



A set of financial statements runs to hundreds of pages, but six numbers are enough to tell whether a business works: revenue, operating margin, net income, cash flow, debt and shareholders’ equity. Not because the rest is irrelevant, but because these six check each other. When one tells a different story from the others, you have found the place worth digging into. This guide explains what each one says, and above all when it stops telling the truth.
Why six numbers, and not one
The temptation is to look for the one decisive metric. There isn’t one, and the reason is structural: any single line of a financial statement can be made to look good for a quarter. Revenue grows if you sell on credit to anyone. Profit rises if you extend the useful life of an asset. Cash improves if you pay suppliers late.
What you cannot do is make all six look good together, for long. That is why they are read as a group: not to compute an average, but to look for contradictions. A healthy company is boring — its six numbers tell the same story. When they diverge, the divergence is the information.
1. Revenue: how much it really sells, and over which period
Revenue is the simplest number and the one most often misread, for a mundane reason: it depends on which time window you are looking at. A quarter is not a year, and the sum of the last four quarters — what is called TTM, trailing twelve months — does not always match the last reported fiscal year.
This is not pedantry. Across our universe of non-financial stocks, roughly one in eleven shows a gap of more than 20% between the sum of quarterly figures and the annual number published by the same source. In the worst cases the gap exceeds 200%: acquisitions consolidated mid-period, fiscal years that do not follow the calendar, reclassifications.
What to do about it: before comparing the growth of two companies, make sure you are looking at the same window for both. A “+30%” computed on one quarter against an “+8%” annual figure is not a comparison, it is a mistake.
2. Operating margin: whether the business itself pays
Operating margin is what remains after running costs, before interest and taxes. It is the number that tells you whether the activity itself is profitable, regardless of how it is financed and where it pays tax.
It is also the most comparable of the six, which is why it is almost always available: in our universe coverage is 100% for US stocks and 98% for European ones. When a company cannot report an operating margin, the problem is usually not a technical one.
The thing to know: operating margin should be compared only within the same sector. A supermarket chain’s 6% and a software firm’s 40% are both excellent outcomes; swapping them round would be a disaster in both directions. A margin only means something next to its peers.
3. Net income: the most visible and the most fragile
Net income is the line that makes headlines, and it is the one most exposed to items that have nothing to do with the business: gains on disposals, write-downs, restructuring charges, one-off tax effects.
There is also a subtler problem, visible only in the detail: when a group consolidates quarters reported in different currencies, the resulting sum is not comparable with the fiscal year. In our universe this affects a small number of companies, but where it happens profit comes out inflated several times over — and at first glance it simply looks like an exceptional year.
The practical rule: profit growing much faster than revenue always deserves a question. It may be genuine efficiency, in which case it also shows up in the operating margin. Or it comes from items that will not repeat next year.
4. Cash flow: the comparison that gives the game away
Cash flow is the hardest number to dress up, because money either comes in or it doesn’t. The comparison that matters is not its absolute level but its relationship with net income: a company reporting profits while generating no cash is either selling to people who don’t pay, or capitalising costs that are costs.
An uncomfortable point has to be made here, and it is the most serious limitation in this guide: cash flow is the least available of the six. In our universe coverage is 77% for US stocks and falls to 59% for European ones. For two European companies out of five the figure simply is not there — and no analysis can invent it.
Watch out for an arithmetic trap too: the ratio of cash to profit loses all meaning as profit approaches zero. A company with near-zero profit and normal cash generation shows a ratio in the thousands of percent, which looks like excellence and is in fact the sign that profit has collapsed. A ratio whose denominator tends to zero stops measuring what it was meant to measure.
5. Debt: the number that hides best
Debt is where we found the most instructive defect, and it is worth telling because it teaches a method.
Many sources publish a “total debt” line in the quarterly balance sheet. In some cases that line carries only the short-term portion, because the long-term debt field was not filled in for that quarter. The result is a company that appears to have no debt. Across a sample of several thousand companies we counted 87 in this condition, and they are not obscure names: they include banks, consumer credit firms and well-known industrial groups.
The extreme case: a US broadcasting group whose quarterly filing showed 80 million in debt against 5.8 billion in the annual accounts. Total liabilities were identical in both documents — 7.7 billion — so the debt was very much there: it was the single field that had not been filled in.
The method that follows applies well beyond this case: an important number should be checked in two different places. If quarterly debt is a fraction of the annual figure while total liabilities do not move, it is not the company that has cleared its debts: it is the data that is incomplete. The same applies to the comparison between debt and enterprise value embedded in valuation multiples: if they imply leverage levels that differ by orders of magnitude, one of the two is wrong.
6. Shareholders’ equity: the denominator behind everything
Equity is what belongs to shareholders, and on its own it says little. It matters as the denominator of two widely used measures: return on equity and the price-to-book ratio.
And this is where a consistency test hides that anyone can run in their head. Between three very common figures a simple identity holds: price-to-book = price-to-earnings × return on equity. It is not a theory, it is algebra: the terms cancel out.
If those three numbers do not reconcile for a company, one of the three is wrong — and you need no external source to notice. Across our universe the check fails on about 40 European and 40 US stocks. In some of those cases the explanation is legitimate: when equity is nearly wiped out, return on equity explodes by construction and the identity loses meaning. For the rest, it is something to look at.
A warning that applies to all six: a very high return on equity is rarely good news in itself. It often comes from equity thinned out by share buybacks — that is, from the denominator, not from better profitability. It should always be read alongside a measure that is not affected by capital structure.
What these six numbers do not tell you
They do not tell you whether a share is expensive. Financial statements describe the company, not the price: that requires multiples and a valuation estimate, which is a different exercise with uncertainties of its own — we wrote about it in why there is no single fair value.
They do not tell you what will happen. They are photographs of the past, months behind today.
And they do not work the same way for everyone. Banks and insurers have structurally different balance sheets: for them the ratio of current assets to current liabilities does not measure liquidity, and several indicators built for industrial companies simply do not apply. It is the same reason accounting warning models must be used with care outside the sector they were built for, as we explained when discussing the accounting signals that come before the trouble.
In short
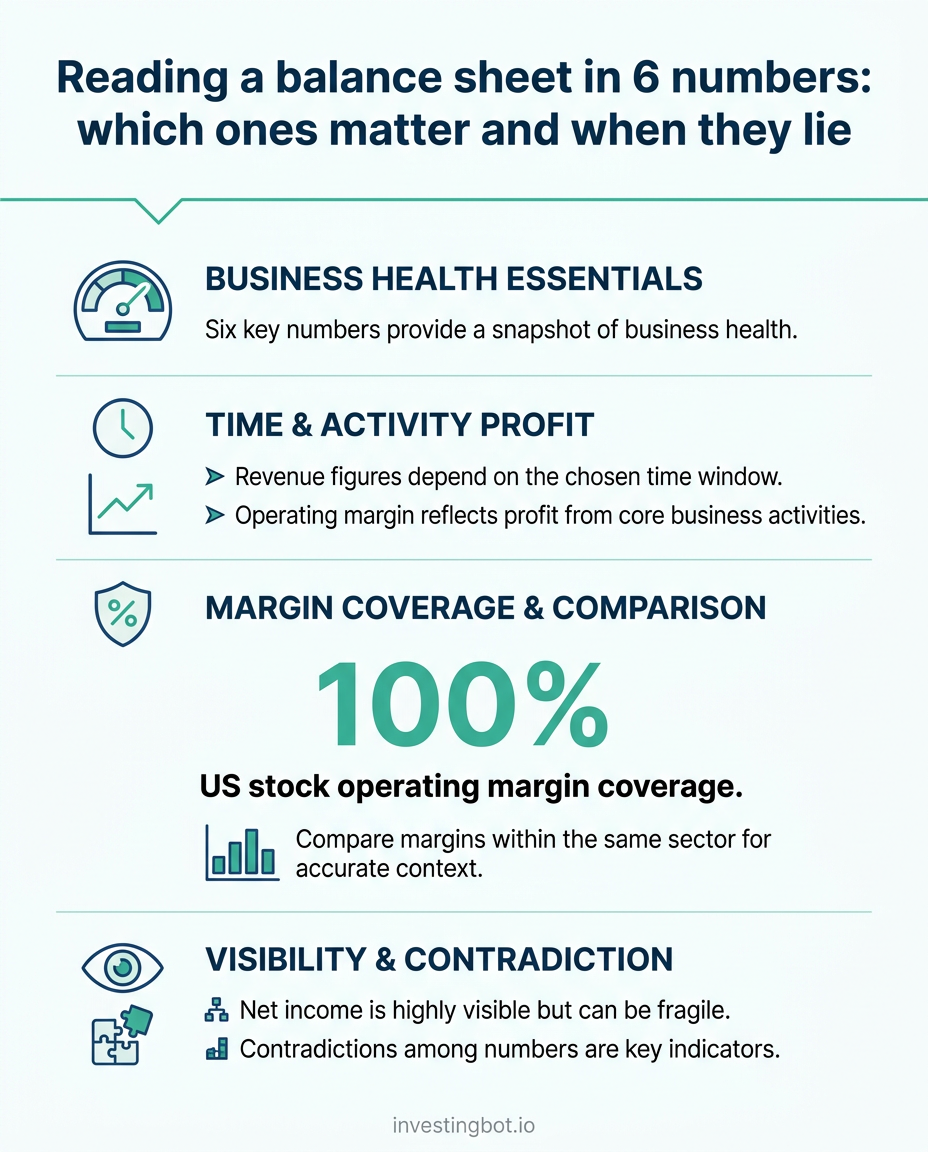
- Revenue: check the time window before comparing two companies. For roughly one stock in eleven the annual figure and the sum of quarters diverge by more than 20%.
- Operating margin: tells you whether the business pays. Compare only within the same sector.
- Net income: the most visible and the most fragile. If it grows much faster than revenue, find out why.
- Cash flow: comparing it with profit is the most honest test, but it is also the least available figure — missing for two European companies out of five.
- Debt: check it in two places. Quarterly debt far below the annual figure, with total liabilities unchanged, means incomplete data.
- Equity: use it as a consistency test. Price-to-book should equal price-to-earnings times return on equity.
The rule that holds it all together: don’t look for the good number, look for the one that contradicts the others.
Frequently asked questions
Which is the single most important number in a financial statement?
None of them, taken alone. If one has to be picked, operating cash flow is the hardest to dress up, because money either comes in or it doesn’t. But on its own it is not enough: a company can generate cash while destroying value, for instance by stopping investment. The six numbers exist precisely because they check one another.
Why are net income and cash flow different?
Because they follow two different accounting logics. Profit records revenues and costs when they accrue, even if no money has moved yet; cash records only money actually received or paid. A difference always exists and is normal. When it becomes large and persistent, it usually means revenue is turning into receivables rather than into cash.
How can I tell whether a reported figure is wrong?
By comparing it with another that should be saying the same thing. Debt is checked in the quarterly and the annual accounts; return on equity is verified through the identity between price-to-book and price-to-earnings; revenue is checked by summing the quarters and comparing with the fiscal year. No external source is needed: most errors give themselves away through internal consistency.
Do these six numbers apply to banks and insurers too?
Only partly. A bank’s balance sheet does not separate current and non-current items the way an industrial company’s does, so liquidity measures built on that distinction do not measure anything. Revenue, margins and equity remain readable, but they must be interpreted with sector metrics: credit quality, coverage ratios, net interest margin.
Where can I find these numbers already calculated?
In the platform’s company pages, where the six numbers are shown together with the consistency checks described here. Where a figure is missing or fails the checks, it is reported as unavailable rather than estimated: an invented number is worse than a missing one.
Sources and references
The coverage percentages and gaps quoted here are measured on the universe of stocks tracked by the platform (several thousand listed companies in Europe and the United States) and recomputed at every data refresh. On the combined use of accounting indicators as an early-warning system, see the classic work of Beneish on earnings quality and Piotroski on fundamental scores.