



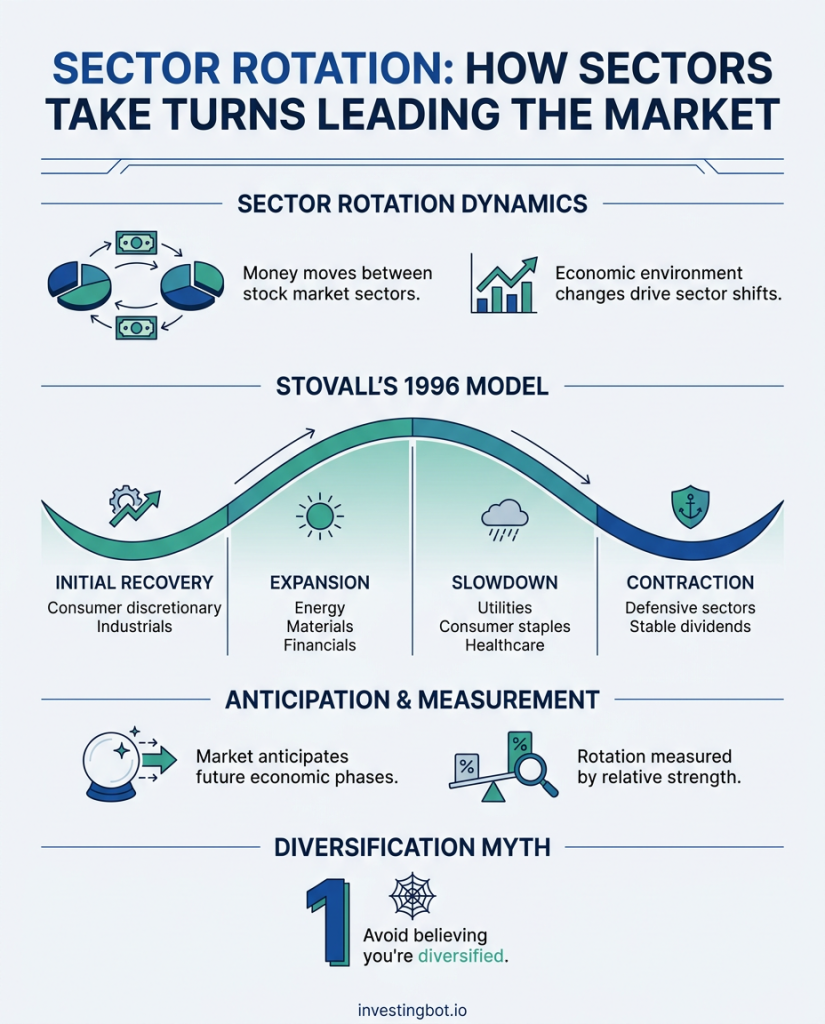
Sector rotation is the way money moves from one sector of the stock market to another over the course of the economic cycle. When the environment changes—growth, inflation, interest rates—the sectors the market rewards also change: from economically sensitive stocks (industry, materials, finance) to defensive ones (consumer staples, utilities, healthcare), and vice versa. Understanding this dynamic isn’t about “guessing the next winner,” but about understanding where money is going and avoiding the most common mistake: believing you’re diversified when, in reality, all your positions are driven by the same engine.
Why sectors pass the baton
The market isn’t a single block: it’s the sum of very different activities, each sensitive to different variables. A bank profits when interest rates rise and loans yield higher returns; a consumer staples company sells toothpaste and detergents even in a recession; a semiconductor manufacturer thrives on technology investments that swell during economic expansions and deflate when the economy slows.
As the economic cycle progresses, investors shift capital toward sectors expected to benefit from the next phase, not the current one. It is this anticipatory movement—the market betting on the future—that generates rotation: some sectors begin to outperform while others lose strength, well before economic data confirms this. The idea of linking cycle phases to specific sectors was popularized by Sam Stovall, among others, in his Standard & Poor’s Guide to Sector Investing (1996), with the famous “sector rotation model.”
The phases of the cycle and the sectors that tend to lead
A simplified diagram — useful as a mental map, not as a precise clock — associates four phases of the cycle with as many groups of sectors:
- Initial recovery (the economy restarts, rates are still low): this phase tends to be led by the most cycle-sensitive sectors—consumer discretionary goods, industrials, basic materials, technology.
- Expansion (solid growth, rising rates): Energy, materials, and financials often lead the way, benefiting from robust demand and higher rates.
- Slowdown (growth is losing momentum, inflation may still bite): money is seeking refuge in defensive sectors — utilities, consumer staples, healthcare.
- Contraction (recession or fear of recession): Defensive sectors and those with stable dividends fare better, while cyclical sectors suffer more.
The temptation is to use this pattern as a calendar: “We’re expanding, so let’s buy energy.” This is where almost everyone gets hurt. The economic cycle has no fixed dates, the phases overlap, and the market anticipates them erratically: sectors have often already rotated before you’ve figured out which phase you’re in. The sequence is a useful basic insight, not a timetable to be followed to the letter.
How to Read Rotation: Relative Strength, Not Absolute Price
The key point, often misunderstood, is that rotation is measured in relative strength: not “this sector is going up,” but “this sector is doing better (or worse) than the market as a whole.” A sector can rise in absolute value and simultaneously lose relative strength if the rest of the market rises more. And in a generalized downturn, the sector “falling less” is actually the one driving the rotation, even if it is losing ground.
To read it, three elements are needed: relative strength (sector versus benchmark), momentum (is the strength accelerating or slowing?), and breadth — the number of companies within the sector actually participating in the movement. A sector driven by two or three stocks is much more fragile than one where the rally is widespread.
The RRG: The Four Quadrants of Rotation
A tool specifically designed to visualize all this is the Relative Rotation Graph (RRG), developed by Julius de Kempenaer (who dedicated the book Relative Rotation Graphs, Wiley 2020, to it). The RRG plots two measures on a graph: on the horizontal axis, the relative strength of a sector compared to the market, and on the vertical axis, the momentum of that strength. This results in four quadrants through which sectors tend to rotate, usually clockwise:
- Leading (high strength, positive momentum): The sector is leading.
- Weakening (strength still high, but momentum declining): the baton is starting to pass.
- Lagging (low strength, negative momentum): The sector is lagging.
- Improving (strength still low, but momentum picking up): possible start of a new climb.
The power of the RRG lies in showing movement, not just position: the “tail” of each sector tells you where it came from and where it’s going. But two honest caveats are in order here. First, a sector in the Improving quadrant is not an automatic buy signal—tails can fold and generate false starts; confirmation is needed. Second, and more importantly, the RRG measures relative strength, not absolute value. A “Leading” sector can still cause you to lose money if the entire market is declining. It’s a rotation compass, not a traffic light to buy or sell.
The uncomfortable limits (that they rarely tell you about)
Sector rotation is fascinating precisely because it seems to offer a “mechanical” advantage: you just need to be in the right sector at the right time. The reality is harsher, and it’s worth stating this clearly.
It’s descriptive, not predictive. Rotation explains well what has happened and what is happening; it’s much less reliable at predicting what will happen. Relative strength momentum—the same phenomenon studied by Narasimhan Jegadeesh and Sheridan Titman in their famous 1993 paper—tends to persist, but with brutal exceptions precisely at turning points, where the baton passes faster than any graph can show.
Correlations rise precisely when diversification is needed. This is the most insidious paradox: in normal times, sectors move fairly independently, and switching from one to another makes sense. But in market crashes, correlations soar, and almost all sectors fall together. Sector rotation, which should protect you, stops working precisely when you need it most. Those who believe they’re diversified because they own “different sectors” often discover, at the worst possible moment, that they have only one bet: the market.
Sector timing is nearly impossible to get right consistently. Entering and exiting sectors requires getting two decisions right (when to enter and when to exit), transaction costs, and, in many jurisdictions, capital gains taxes that erode realized gains. Rotation is valuable as a lens for reading the market; it’s dangerous if it turns into a strategy of frenetic entries and exits.
How to use it in practice (without fooling yourself)
The mature way to use sector rotation isn’t to “buy the leading sector,” but to understand the context. Knowing whether the market is favoring cyclicals or defensives tells you what regime you’re in and what risks you’re taking, even without changing a single position. It helps you recognize when the rally is wide (many sectors participating, a healthy picture) or narrow (a few sectors pulling everything, a fragile picture). And it forces you to ask a useful question: are my positions truly different from each other, or do they all depend on the same engine?
On the platform, this understanding is made concrete by several tools that work together: the RRG to see rotation in motion, the Sector Strength to measure which sectors and subsectors are leading on different horizons, and the Correlations to verify how much sectors actually move independently—especially under stress. They are contextual tools, not “buy/sell” signal generators: that’s the whole difference.
In summary
- Sector rotation is the movement of money between sectors along the economic cycle: from cyclicals to defensives and vice versa.
- It is measured in relative strength (sector versus market), not in absolute price: a “Leading” sector can still lose value if the market falls.
- The RRG displays rotation in four quadrants (Leading, Weakening, Lagging, Improving), but it is a rotation compass, not a traffic light.
- The limitations are serious: it is descriptive rather than predictive, correlations rise in crashes (sectors fall together), and timing is very difficult to get right consistently.
- True value is as a contextual lens: understanding the market regime and checking whether you are truly diversified — not as an entry and exit strategy.
Frequently Asked Questions
What is sector rotation?
It’s the movement of capital from one stock market sector to another over the course of the economic cycle. When growth, inflation, and interest rates change, the market rewards different sectors: during expansion phases, it tends to favor cyclical sectors (industry, materials, finance, technology), while during slowdowns, it favors defensive sectors (consumer staples, utilities, healthcare).
Which sectors lead at each stage of the cycle?
A classic framework associates the initial recovery with consumer discretionary and technology, the expansion with energy, materials, and finance, and the slowdown and contraction with defensive sectors. This is a useful mental map, but not a timetable: the phases overlap, and the market anticipates them erratically, so it should be used as a basic intuition, not a mechanical rule.
Does RRG really work?
The RRG is an excellent tool for visualizing rotation, as it simultaneously shows relative strength and momentum and their movement over time. However, it is not a buy signal generator: it measures relative strength, not absolute value, and a leading sector can still lose if the overall market declines. It should be viewed as a contextual compass, not a traffic light.
Can I market-time sectors?
In theory, yes, but in practice, it’s very difficult to consistently do: it requires guessing both entry and exit, incurs transaction costs, and, in many jurisdictions, taxes on realized capital gains. Furthermore, during crashes, correlations rise and sectors fall together, negating the advantage. It’s more prudent to use rotation to understand the context and risks, not to constantly enter and exit.
This article is for informational and educational purposes only and does not constitute personalized financial advice or a recommendation to buy or sell financial instruments. Investment decisions should take into account your personal circumstances; if in doubt, please consult a qualified advisor. Where mentioned, taxation varies by jurisdiction: check your country’s regulations.