



An annual charge of 0.20% looks like nothing. Over twenty years it isn’t: it is the difference between capturing the market’s full return and capturing a slice less, taken every single day without anyone seeing it. This guide explains what an ETF’s headline cost actually covers, what it leaves out, and how much the gap is worth — with figures measured across our own ETF universe, including the awkward one: on the same index, returns diverge more than costs do, and the reason is almost never the one you’d expect.
The headline cost: what the TER tells you
The TER (Total Expense Ratio, or ongoing charge) is the annual percentage the fund keeps to run itself: management fee, depositary, audit, administration. You never pay it by transfer — it is deducted from the unit price every day, in fractions of a basis point. That is exactly why it never appears on a statement and why almost nobody notices it.
The practical consequence is that the return you see is already net of the TER. Convenient, but it hides the point: that slice wasn’t given up once, it was given up every year, and the capital it would have compounded on is gone.
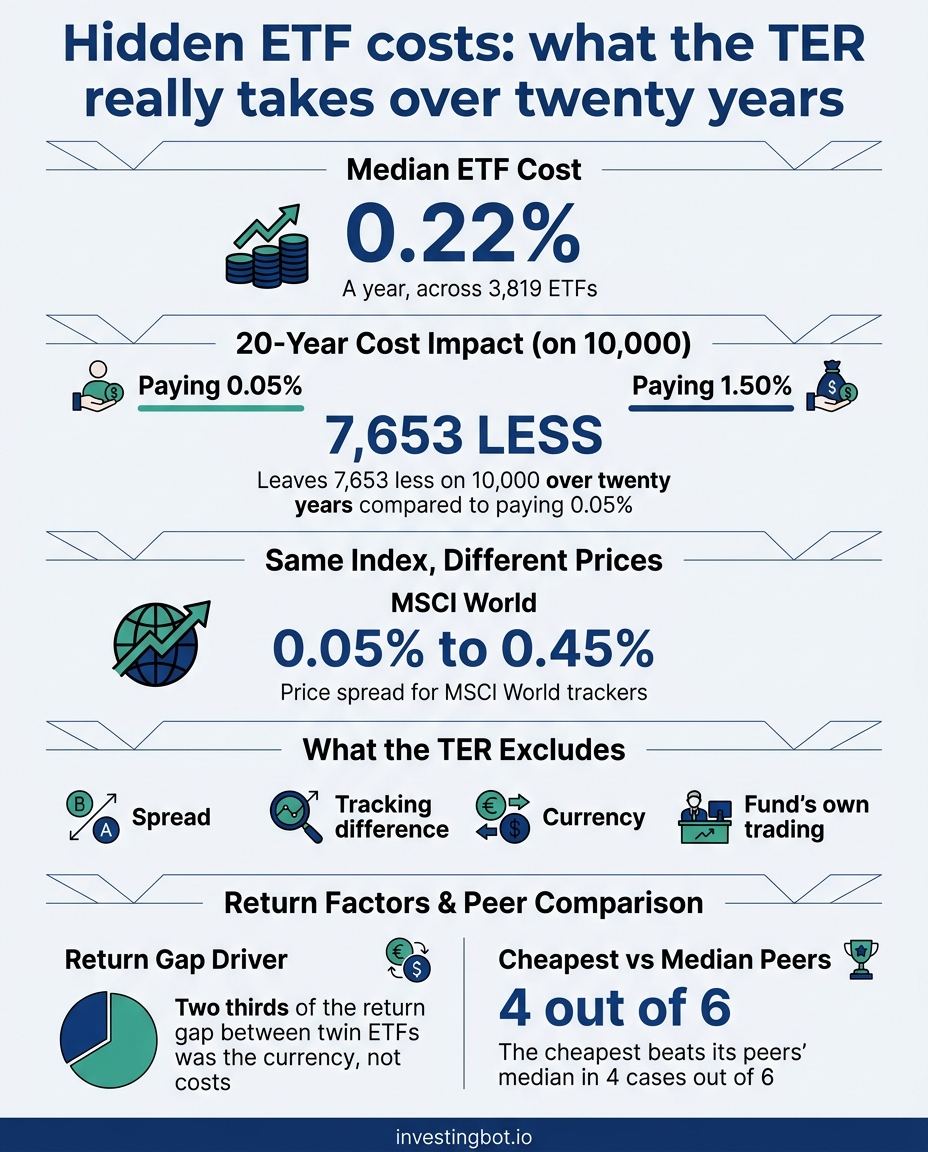
Across our universe of 3,819 ETFs, the headline cost has a median of 0.22% a year. One ETF in eight sits below 0.10%, one in ten is above 0.50%, and the most expensive reaches 1.50%. The distance between those extremes is not a pricing detail — it is the rest of this article.
What it costs over twenty years
No forecast is needed here, just arithmetic. Take 10,000 invested and a hypothetical gross return of 6% a year — a stated assumption, not a promise: it exists only to put the costs on a common scale.
| Annual cost | After 20 years | Shortfall vs gross |
|---|---|---|
| 0.05% | 31,770 | 301 (0.9%) |
| 0.20% | 30,883 | 1,189 (3.7%) |
| 0.50% | 29,178 | 2,894 (9.0%) |
| 1.00% | 26,533 | 5,538 (17.3%) |
| 1.50% | 24,117 | 7,954 (24.8%) |
Between the cheapest and the dearest in our universe the difference is 7,653 on 10,000 invested: more than two thirds of the starting capital, lost to fees and to the return those fees never generated. And the more realistic comparison — between the median 0.20% and a 0.50% that still sounds reasonable — is still worth 1,705.
The mechanism that makes these numbers bigger than intuition suggests is always the same: compounding works for whoever collects the fee too. Every point withheld removes not just itself, but everything it would have earned in the years that follow.
Same index, very different prices
An ETF tracking an index has no room for creativity: it buys what the index holds. You would therefore expect two ETFs on the same index to cost the same. They don’t.
Our universe contains 231 indices tracked by at least three ETFs. The typical spread between dearest and cheapest is modest — 0.04 percentage points at the median, with the dearest costing roughly 1.3 times the cheapest — but the tail is anything but harmless:
- MSCI World: 14 ETFs on the same index, from 0.05% to 0.45% — nine times as much;
- MSCI Emerging Markets: from 0.09% to 0.60%;
- MSCI Japan: from 0.06% to 0.52%;
- MSCI USA: from 0.03% to 0.30%.
On an index that well known, the difference buys nothing different: it is the same basket at two prices. This is where comparing before you buy costs ten minutes and is worth, over the twenty years in the table above, thousands.
The costs the TER leaves out
The TER is the headline cost, not the total cost. Four items sit outside it, and none of them shows up in a comparison table.
The bid-ask spread
This is the gap between the price you can buy at and the price you can sell at, at the same moment. It is paid on every trade, so it matters in proportion to how much you trade: irrelevant if you buy and hold, significant if you move in and out. On heavily traded ETFs it is a few hundredths of a point; on thin ones a single trade can exceed the annual TER.
Tracking difference
This is the gap between what the ETF returned and what the index it follows returned. It includes the TER, but also replication error, the treatment of withholding tax on dividends, and the timing of rebalancing. It is the number that actually matters, and it is also the only one you won’t find in a fact sheet in comparable form.
Currency
An ETF on a US index quoted in another currency does not remove currency risk: it moves it. Hedged share classes reduce it, but that hedge has a cost, driven by the interest-rate differential between the two currencies, and it does not appear in the TER. That isn’t a flaw: it is the price of a service, and it should be compared against what you actually want from it.
The fund’s own trading costs
When the index changes composition, the fund buys and sells — and pays. On stable indices this is negligible; on indices that turn over often it isn’t. Some funds recover part of it by lending out their holdings, which is revenue but also additional risk: those that do disclose it in the prospectus.
What our data says (and what it can’t say)
Here comes the awkward part, and we’re telling it in full because it is the useful one.
Comparing ETFs on the same index, the gap in three-year returns dwarfs the gap in costs: 2.91 points a year against 0.04. That looks like proof the TER barely matters. But before writing it down we stripped out the explanations that have nothing to do with costs:
- excluding currency-hedged ETFs, the gap doesn’t move (2.93 points);
- comparing only ETFs quoted in the same currency, it collapses to 0.78 points: two thirds of the gap was simply the exchange rate;
- adding the same dividend treatment — distributing versus accumulating — leaves 0.88 points, but the genuinely comparable groups drop to six.
Six groups do not establish a general rule, and we’re not pretending otherwise. What remains is a signal consistent with the individual cases, where the return gap still exceeds the cost gap:
- S&P 500: four ETFs, same currency, annual returns from 20.61% to 21.07% — 0.46 points apart against 0.10 points of cost;
- EURO STOXX 50: three ETFs, from 17.50% to 18.60% — 1.10 points, against 0.13 of cost;
- MSCI Europe: four ETFs, from 15.14% to 16.23%.
The honest reading is this: the lowest cost is a good starting point, not a guarantee. Across those groups the cheapest one beats the median of its peers in four cases out of six — better than a coin toss, but not automatic.
Two minor details, measured on the same universe: larger ETFs cost slightly less than small ones (0.15% against 0.20% at the median), and synthetic replication is marginally dearer than physical (0.24% against 0.20%), which contradicts the idea that it is systematically cheaper.
How to choose without chasing the last basis point
If the TER doesn’t explain everything, the conclusion is not to ignore it: it is to put it in its proper place, which is first among the verifiable criteria, but not the only one.
- Compare within the same index. A 0.07% charge on one index and 0.30% on another aren’t comparable: you are looking at two different products.
- Then within the same currency and dividend treatment. That is the step that, in our measurement, made two thirds of the apparent differences disappear.
- Look at tracking difference over several years, not just the TER. If an ETF costs 0.10 points less but lags its index by 0.30 points a year, the saving doesn’t exist.
- Factor in how much you trade. If you buy once a year, the spread barely matters and the TER matters a lot. If you move in and out, the order reverses.
- Be wary of differences under two hundredths of a point. Over twenty years they are worth a few tens on ten thousand: below that threshold, other things decide — fund size, ease of trading.
On tax we give no numbers, because they change completely from place to place: in some jurisdictions accumulating share classes are treated appreciably differently from distributing ones, in others the difference is minimal or non-existent. It is a variable that can outweigh the entire TER, so it is worth checking the rules in your own jurisdiction, or asking an adviser.
In short
- The median headline cost across our universe of 3,819 ETFs is 0.22% a year; one in ten exceeds 0.50%.
- Over twenty years, on a hypothetical 6% gross return, paying 1.50% instead of 0.05% leaves 7,653 less on 10,000.
- On the same index prices diverge: MSCI World runs from 0.05% to 0.45% for the same basket.
- The TER is not the total cost: spread, tracking difference, currency hedging and the fund’s own trading costs all sit outside it.
- In our data the return gap between ETFs on the same index exceeds the cost gap — but two thirds of that gap was the currency, and only six groups are fully comparable: a signal, not a law.
- The lowest cost is the right starting point; the check that counts is how closely the ETF stays with its index over the years.
Is the TER charged separately, or is it already in the return?
It is already in it. It is deducted from the unit price every day, so the return you read is net. That is precisely why it goes unnoticed: there is no charge to spot, only a value slightly lower than it would otherwise have been.
Does an extra 0.20% really matter, or is that nitpicking?
It depends on the horizon. Over one year it is twenty on ten thousand and changes nothing. Over twenty years, on a hypothetical 6% gross return, the difference between 0.20% and 0.50% is worth roughly 1,705 on 10,000 invested — because what is taken out no longer compounds in the years that follow.
Why do two ETFs on the same index cost so differently?
The reasons are commercial rather than technical: how old the product is, its size, the issuer’s policy, and the fact that many investors never compare. The underlying basket is identical, so on widely held indices the price difference buys nothing different.
Should I just take the cheapest one?
It is the right starting point, but it needs checking. What counts is tracking difference over time: an ETF that costs little but follows its index poorly returns less than a slightly dearer one that follows it well. In our data the cheapest in a group beats its peers’ median in four cases out of six — often, not always.
Do currency-hedged ETFs cost more?
Their TER is generally higher, but the real cost of hedging isn’t there: it depends on the interest-rate differential between the two currencies and it changes over time. It is neither waste nor an automatic advantage — it is the price of removing one variable, and it makes sense only if that variable genuinely bothers you.
How do I see the costs the TER doesn’t include?
Tracking difference is the most direct way: compare the ETF’s return with its index’s over several years, and the gap contains everything, TER included. The spread, by contrast, is read live in the market, by looking at the distance between buying and selling prices at the moment you want to trade.