



Anyone opening a company page on a financial website takes the numbers for granted: the price, the share count, the debt, the earnings. After a year spent checking those numbers against each other and against the official filings, we can say something simple: no single source is reliable, not even the paid ones. Not out of carelessness: market data travels through a chain of providers, and every link adds a convention, a delay or an error that nobody downstream checks. This article explains where data breaks, with the real cases we found across about 3,500 US companies, and what we do every night so as not to show it broken.
The rule we follow fits in three lines: a number is shown only if two independent sources confirm it; where they disagree, the document filed with the SEC, the US securities regulator, read directly, wins; and where even that does not settle it, the number is not shown. One number fewer, with the reason written next to it, is worth more than a plausible, wrong one.
Where market data comes from, and why it breaks
Almost no website produces the data it displays. Prices come from the exchanges through a distributor; financial statements are extracted by a vendor from the documents companies file; analyst estimates are collected by a third party; share counts, dividends and splits come from a fourth. Each vendor has its own conventions and its own timing, and the site that assembles them usually shows them as they arrive.
Errors cluster where the chain is longest and the company is smallest. On the large ones, which everybody watches, the numbers match to the cent: in our tests Apple, Microsoft and Coca-Cola are identical across the main source, a second source and the filed accounts. On the small ones, especially after a corporate event, sources often diverge, and nobody notices because nobody looks. It is the same mechanism we described in the article on small investors and individual stocks: attention, and therefore care, goes where the money is.
The share count: the number that changes everything
The number of shares outstanding is the most underrated figure on a company page. Multiplied by the price it gives the market capitalisation, that is, what the company is worth on the exchange; divided into profit it gives earnings per share; from there come the P/E, the P/B and almost every multiple. If it is wrong, everything is wrong, and invisibly so, because the page keeps showing reasonable-looking numbers.
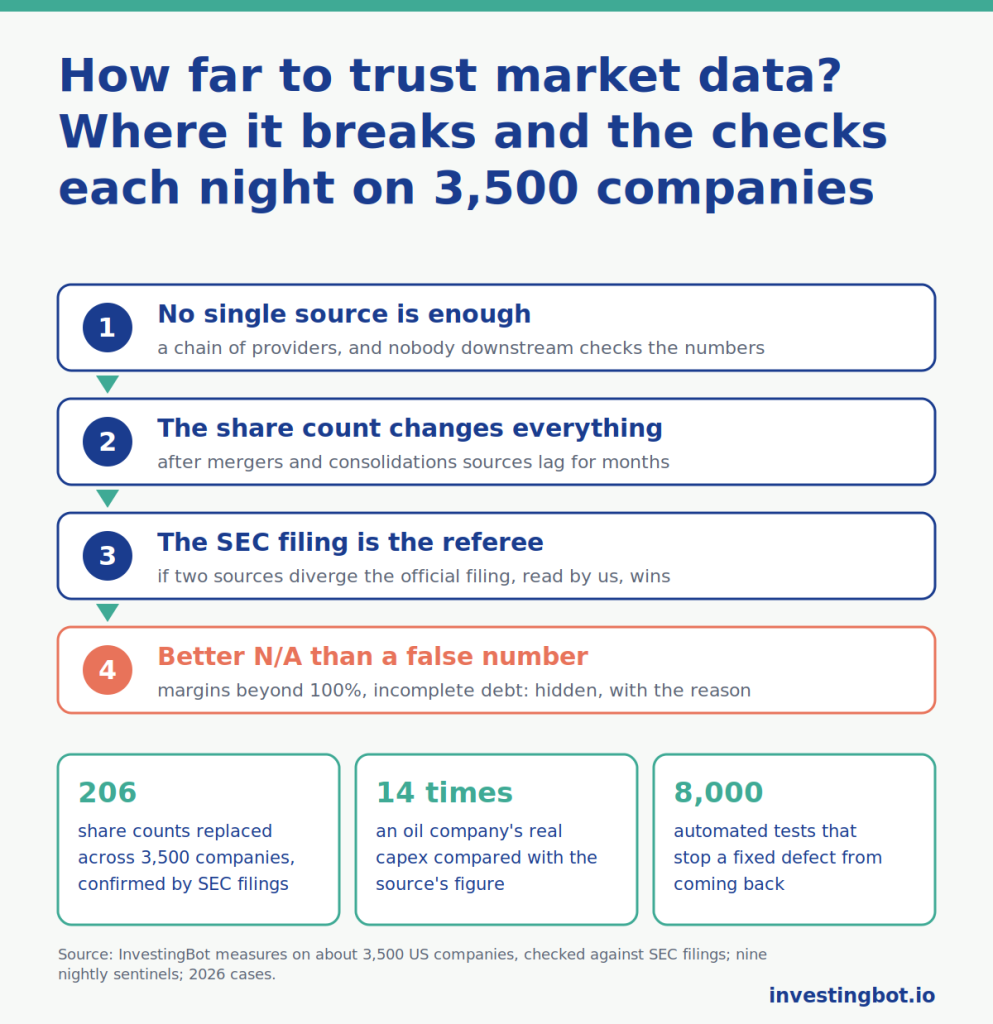
And it is wrong more often than people think. When a company lists, merges, consolidates its shares or issues new ones, the count changes in a day, but sources update it when the next set of accounts comes out, that is, up to three months later. In our universe of about 3,500 companies, comparing three sources every night, in 206 cases the main source’s value was not the right one and we replaced it with the value confirmed by the filed accounts; in another 57 the sources contradicted each other without any of them being provably right.
Those 57 we checked one by one against the documents filed with the SEC: listing prospectuses, merger closing announcements, cover pages of quarterly reports. A few examples of how far apart the sources were. ProKidney, a biotech with two share classes: one source counted 148 million shares, another 399; the document filed on October 29 says 302.4 million, adding the two classes. Accelevation, listed on October 1: the main source was stuck at 30 million shares, the prospectus counts 225 million across the two classes, so the market capitalisation shown was seven and a half times too low. Nine companies had consolidated their shares, at ratios from 1-for-4 up to 1-for-125, and the source was still counting the pre-consolidation shares. In one case of a foreign company listed through depositary receipts, a source was using the old ratio between receipt and share, and the count came out double.
Where the document does not settle it, the number stays flagged as uncertain: three companies that have just closed a merger have not yet published a definitive count, and we do not invent one.
The missing investment: the case of the oil companies
Free cash flow, the money a company has left after paying for its investments, is one of the most used numbers for judging a business. To compute it you need capex, the spending on plant and reserves. We found that for oil companies the main source was taking only the line “other plant and equipment” and ignoring the development of reserves, which is the real spending. For EOG Resources capex came out at 479 million dollars; the accounts filed with the SEC report 6,594, fourteen times as much. Free cash flow, and the cash yield derived from it, were inflated in proportion across 38 companies in the sector.
Now, where the source has no capex or has less than half of the filed figure, we read it from the SEC accounts. For another 54 companies, which had no capex at all, we recovered it from the SEC under a strict rule: the reading must match at least three independent checks, otherwise it stays empty. We measured that a looser rule, “matches the source over two periods”, was wrong about one time in five. Better 54 certain values than 150 of which 30 are wrong.
Earnings, revenue and quarters: when the source is late or reads the wrong line
Three classes of error keep coming back in the accounts.
The first is scale: a quarter rebuilt with shares expressed in thousands instead of units produces absurd earnings per share. Our check found 197 of them: McDonald’s came out with three million dollars of earnings per share. Now, if earnings per share, share count and total profit do not add up, the value is recomputed and shown only if a second source confirms it.
The second is delay: for about a hundred and fifty companies the source was stuck on a quarter more than a hundred days old while the new accounts were already filed. For 97 of them we take the latest quarter directly from the SEC filings, but only after a test: the previous quarter, rebuilt from the SEC with the same method, must match the source’s within 0.5 per cent. Where the test fails, the page says the accounts are behind, and by how much.
The third is the wrong line: the source takes a component of revenue instead of the total. NextEra Energy came out with 25.8 billion of revenue against the 27.4 filed; Interactive Brokers with 2.4 billion against 6.2. We measured this across more than 3,300 companies: in the great majority the total matches, but in a handful of cases the source reports a partial line, and the fix has to be made company by company, because the opposite rule, “always take the largest line”, would go wrong elsewhere by mistaking a gross figure for the total.
Splits and dividends: the past that does not get updated
When a company splits its shares, say two new ones for each old one, every per-share figure from the past has to be divided by two: prices, dividends, analysts’ target prices. Sources do this for prices and often not for the rest. Across 1,418 companies with a dividend history comparable between two sources, three carried an unadjusted dividend: Amphenol showed a dividend of 0.25 dollars after its 2-for-1 split in September, when the adjusted value is 0.125. Few cases, but a doubled yield on one stock is a serious error for someone buying it for the dividend.
Analysts’ target prices are worse, because the source aggregates them over a one-year window that mixes estimates from before and after the split. After Monster Beverage’s 2-for-1, the average target came out at 69.90 dollars, impossible for a stock at 50: recomputed on the post-split estimates alone it is 50.83. Where the window cannot be cleaned, the target is not shown and the page explains why.
Debt: never zero by mistake
Debt is the figure that most often arrives incomplete: the source reports one line in three of the liabilities, and the debt-to-equity ratio comes out tiny. For Baxter, in the most recent quarter, the source gave 206 million of debt against the 9.67 billion in the filed accounts. So we have a fixed rule: debt is never zero for lack of data. It is taken from the source, checked against the matching line of the SEC accounts read with a method calibrated on each company, and if the source reports a value that has collapsed against the previous quarter with no visible reason, the ratio is not shown. A “not available, because the reported debt is incomplete” is information; a 0.06 in place of 2.3 is a trap.
Numbers that mean nothing
Not every error is the source’s: some are exact numbers that no longer measure anything. A net margin of 7,000 per cent is arithmetically correct if a company has almost no revenue and an extraordinary gain, but it does not describe the business. We counted 22 companies with a net margin above 100 per cent, where profit exceeds revenue because of a one-off gain or because of how the source counts banks’ revenue, and another 84 with margins beyond 1,000 per cent in absolute value, where revenue is close to zero. In all these cases the page shows “not available” and the reason, instead of the number. The same goes for a P/E with negative earnings, a PEG on a loss-making company, a price-to-book when equity is negative, and tangible book value when the accounts do not disclose goodwill.
Tangible book value deserves a line of its own, because it is the case where checking changed the most numbers. We compute it from the SEC accounts, removing goodwill and intangibles, and every night we compare it with an independent source: for about 2,300 companies our value is confirmed, for about a hundred it diverges, and for that hundred we do not show it until we understand who is right. In several cases we found that the difference lay in the definition, for instance in banks’ mortgage servicing rights, and we wrote the rule accordingly.
What happens every night
None of this is a one-off job. Every night a chain of more than fifty steps rebuilds the data for every company, and nine sentinels read it back looking for inconsistencies: the same number coming out differently in two places on the platform, a ratio outside the range of the possible, a price stuck for three sessions, a source that has stopped updating, a renamed ticker. This morning, for instance, the sentinels had produced 69 findings; the serious ones are closed before any other work, and the register does not allow a day to be declared closed while one is left unanswered.
Every working day, in addition, we read in full a sample of everything the platform has generated, analyses and assistant answers included, and we check every number quoted against the underlying data. And a suite of nearly eight thousand automated tests runs on every change to the code: when we fix a defect, the test that recognises it stays, so the defect cannot come back silently.
The checking applies to us too. Recently we discovered that our own automated tests, running at night, had mistakenly overwritten the cache of two companies with data from a quarter earlier. It was found by a sentinel that compares the same yield computed two ways. We fixed it, and we write it here because that is the point: nobody is free of errors; the difference is having something that looks for them.
What it means for someone reading a company page
It means three practical things. First: when the page says “not available”, it is not a gap, it is a choice, and hovering over it shows the reason. Second: when a number carries a note, for instance “shares verified against SEC filings” or “capex from filed accounts”, it means that number does not come from the main source but from a check that replaced it, and the document can be traced. Third: prices are delayed by 15-30 minutes, and we say so; anyone who needs a real-time price to trade should use their broker’s platform, not an information page.
We do not promise perfect data: nobody can. We promise that every number shown has passed at least one independent check, that those which have not passed are not shown, and that the method is written down and can be verified. In the article on fundamental analysis we measured how much reading the accounts is worth: it is worth something only if the accounts you read are the real ones.
In summary
- Market data travels through a chain of providers, and errors cluster on small companies and after corporate events: listings, mergers, consolidations, splits.
- The share count is the most fragile figure: in 206 cases out of 3,500 we replaced it with the value confirmed by SEC filings, and 31 uncertain cases we checked by hand against the documents.
- Capex, earnings per share, revenue, quarters, dividends, target prices and debt each have a typical error class; for each there is a check and a rule for replacement or exclusion.
- An exact number can mean nothing: margins beyond 100 per cent, a P/E with negative earnings, negative equity. In those cases we show “not available” and the reason.
- Every night a chain of more than fifty steps and nine sentinels look for inconsistencies; nearly eight thousand automated tests stop fixed defects from coming back.
- We do not promise perfect data: we promise that what you see has passed an independent check, and that what has not passed is not shown.
Why does free market data contain errors?
Because almost no website produces the data it shows: it buys it from a chain of providers and publishes it as it arrives, without reconciling it. Errors cluster on small companies and after corporate events, where nobody checks because attention, and revenue, goes to the large stocks.
Which figure is most often wrong on a company page?
The number of shares outstanding. It changes in a day after a listing, a merger or a consolidation, but sources update it with the next set of accounts. Market capitalisation, earnings per share and almost every multiple depend on it: in our universe we replaced it in 206 cases out of about 3,500.
What does “not available” mean on an InvestingBot page?
That the number exists in the source but has not passed a check, or that it measures nothing: a margin beyond 100 per cent, a P/E with negative earnings, debt reported incompletely. Hovering over it shows the reason. One number fewer with the why is worth more than a plausible, wrong one.
Why do SEC documents count more than commercial sources?
Because they are the original documents, filed by the company under its legal responsibility, and they are public. Commercial sources read and summarise them, and in the summary scales, lines and dates get lost. When two sources contradict each other, the SEC filing read directly is the referee.
How do you know a figure is right without a perfect source?
By comparing independent sources with each other: a number is shown if two confirm it. Where they diverge, it is read from the filed document; where even that does not settle it, it is not shown. The method is tested first on known cases, for instance on large companies where all sources agree, and we measure how many values it changes before applying it.
Are the prices on the pages real-time?
No, they are delayed by 15-30 minutes, and we state this next to the price. Anyone who trades needs their broker’s real-time price; an information page is for understanding the company, not for deciding the moment of the order.
Does InvestingBot make mistakes too?
Yes, and we say so. Recently our automated tests had overwritten the cache of two companies with data from the previous quarter; a sentinel that compares the same value computed two ways found it. The difference is not never being wrong: it is having something every night that looks for errors, ours included.