



“Buy the market” is the advice most often given to new investors: instead of picking individual stocks, you buy an index fund and own everything. But everything of what? For many people “the market” means the S&P 500, the roughly 500 largest US companies. For others it is the whole US market, small companies included. For others still it is the world, with or without the United States. These sound like nuances. They are different choices, holding different companies at a different price.
This article closes a series. We have explained why, for a small investor, picking a few stocks is an uphill battle in statistical terms, and why a thematic ETF is more of a bet than a diversification. The underlying question remains: “the market” is a choice too, and it has a price. We set out what the most common definitions contain, what they cost according to MSCI’s official data at the end of September 2026, what research says about why the largest companies are more expensive, and a measure based on our own data: the price-to-earnings ratio of about 3,200 US companies, split by size, with and without the loss-makers.
There is more than one market
When people say “the market” they almost always mean an index, and an index is a list of companies chosen by precise rules. Five lists are used most often, and each holds something different.
- Large US companies. This is S&P 500 territory: its members are chosen by a committee against a set of requirements, including a profit over the latest year. The MSCI USA index, which covers the same band of large and mid-sized companies, held 513 of them at the end of September and covered about 85% of US stock market value.
- The whole US market. Small companies are added to the large and mid-sized ones: the MSCI USA Small Cap index counts 1,669, together worth about 14% of the market. There are many of them, but they weigh little.
- The world. The MSCI ACWI index brings together 2,414 large and mid-sized companies from developed and emerging countries; adding the small ones, in the MSCI ACWI IMI version, takes it to 8,036.
- The world excluding the United States. The MSCI ACWI ex USA index holds 1,901 companies: Europe, Japan, the United Kingdom, Canada, China, India, Taiwan and the rest.
- Small companies. A world of their own, with their own indices: across the whole planet MSCI counts 5,622.
One figure surprises anyone who thinks they diversified by buying “the world”. At the end of September 2026 the United States made up 64.2% of the global index of large and mid-sized companies and 63.0% of the one that also includes small companies. Whoever buys the world is buying America, for almost two thirds.
Widen the view and the price changes
To compare what these pieces of the market cost, the usual tool is the price-to-earnings ratio, the P/E: it says how many years of earnings you pay to buy the companies. It can be calculated on the earnings of the last 12 months, which are facts, or on those expected for the next 12, which are analysts’ estimates. According to MSCI’s official data at 30 September 2026:
- US large and mid caps (MSCI USA): 25.4 times the earnings of the last 12 months, 19.4 times expected earnings;
- the whole world (MSCI ACWI): 21.4 and 16.3;
- the world excluding the United States (MSCI ACWI ex USA): 16.6 and 12.7;
- US small caps (MSCI USA Small Cap): 29.5 and 17.3;
- small caps worldwide (MSCI ACWI Small Cap): 23.4 and 15.5.
Outside the United States, each dollar of earnings costs about a third less: 16.6 against 25.4. The whole world sits in between, closer to America because America is its largest part. Small companies are a curious exception: on past earnings they look more expensive than the large ones, on expected earnings cheaper. It is not a mistake: it depends on how loss-making companies are counted, and we come back to it below.
Why America costs more: the substance
Part of the gap has concrete reasons, and the first is composition. In the MSCI USA index technology made up 39.5%, in the index of the world excluding the United States 21.9%. Outside America financials weigh more: 25.1%, against 11.2% in the United States. Technology companies have on average higher margins and faster-growing earnings, and the market pays more for them; banks, industrials and energy cost less even when they are no bargain at all.
Comparing the P/E of two markets, then, does not mean comparing the same basket at two prices: it means comparing two different baskets. A European index does not become American just because it is cheaper, and an American index is not expensive just because it costs more.
…and the flows: passive money pushes the largest companies harder
Substance does not explain everything. In our article on small investors we described the finding of Xavier Gabaix (Harvard) and Ralph Koijen (Chicago Booth): the stock market is “inelastic”, and every extra dollar moved into equities lifts its total value by about five, because holders sell little and the new price applies to every share. Two studies published in 2025 looked at what happens when those dollars arrive through index funds.
The first is “Passive Investing and the Rise of Mega-Firms” by Hao Jiang (Michigan State University), Dimitri Vayanos (London School of Economics) and Lu Zheng (University of California, Irvine), published in the Review of Financial Studies. A passive fund buys each company in proportion to its stock market weight, so it looks neutral. The authors show it is not neutral for prices: flows into passive funds push up the shares of the largest companies more, especially those already overvalued. The reason is that they widen those stocks’ own swings, which discourages the active investors who should be correcting prices. In the data, after inflows into the S&P 500 it was precisely the largest companies in the index that earned the highest returns. And the market as a whole can rise even when the money is not new, but simply moves from active to passive funds.
The second is “How Competitive Is the Stock Market?” by Valentin Haddad (University of California, Los Angeles), Paul Huebner (Stockholm School of Economics) and Erik Loualiche (University of Minnesota), published in the American Economic Review. An index fund does not react to prices: it buys and sells only according to the money it receives. By the authors’ estimates, the growth of passive management over the past twenty years has made demand for individual stocks 11% more inelastic. Other investors react and become more aggressive, but they offset only about two thirds of the effect. The result is a market in which the same flow of money moves prices more than before.
Taken together, these studies say that whoever buys only large US companies is buying the part of the market that receives passive fund money first, and in the largest amount. It is not a forecast: it is a description of how today’s prices were formed, and it says neither that the phenomenon will soon disappear nor that it will continue.
The label is no longer enough: the index effect has almost vanished
One finding seems to point the other way. Robin Greenwood and Marco Sammon, both of Harvard Business School, in “The Disappearing Index Effect”, published in 2025 in the Journal of Finance, measured how much extra a stock earned in the days when it was added to the S&P 500. In the nineties the abnormal gain averaged 7.4%; over the last decade it fell below 1%, even though the share of assets tied to the index grew enormously. The same happened to companies leaving it.
The two facts fit together. Joining an index is an announced, expected event that traders now anticipate, and joining alone hardly gives anything any more. What weighs on prices is the continuous flow that reaches index funds every month and is spread in proportion to company size. The label does not matter; what matters is how much money arrives and where it goes.
Our measure: about 3,200 US companies
We repeated the comparison on the platform’s data at 1 November 2026: 3,203 companies listed in the United States, with the different share classes of the same company added together, ranked by stock market value. For each group the P/E is calculated the way indices do it: total market value divided by total earnings over the last 12 months. We calculated it in two ways: counting only profitable companies, and counting losses as well.
Profitable companies only
- the top 10, which alone are worth 36% of the entire US market: 24.3;
- the top 500: 23.9;
- companies ranked 501 to 1,000: 19.3;
- companies ranked 1,001 to 3,000: 16.7.
Moving towards smaller companies, the price of earnings falls: small profitable companies cost about a third less than large ones. The same happens when every company is given the same weight: 21.6 for the top 500, 14.9 for those ranked 1,001 to 3,000. The ten largest, on the other hand, are not much more expensive as a group than the other large companies: their weight comes mainly from the size of their earnings.
Counting losses as well
The picture changes when you look at companies that closed the last 12 months with a loss. Among the top 500 they are 5.2%, among those ranked 501 to 1,000 15.0%, among those ranked 1,001 to 3,000 28.6%, almost three in ten. For some companies, 16.7% in the last group, 12-month earnings could not be calculated and we left them out of both counts.
Adding losses to earnings, as MSCI does, the P/E of the top 500 rises from 23.9 to 25.3, almost exactly the 25.4 of the MSCI USA index. That of companies ranked 501 to 1,000 goes from 19.3 to 29.3, very close to the 29.5 of MSCI’s US small cap index. For companies ranked 1,001 to 3,000 the calculation loses meaning: the losses of those in the red, about 131 billion dollars, almost cancel out the earnings of all the others, about 135 billion. They include accounting write-downs at groups in trouble and young companies that have no earnings yet.
The traps of a low P/E
Faced with these numbers the temptation is simple: buy whatever costs least. There are at least four reasons to go slowly.
- A low P/E does not mean a bargain. It often reflects lower expected growth, more cyclical sectors or higher risk. One market can stay cheaper than another for decades without the gap closing.
- Small companies are only half cheap. Counting only profitable ones they cost 16.7 times earnings; counting the loss-makers too, the group as a whole barely earns anything. On analysts’ estimates US small caps become cheap again, 17.3, but an estimate is a forecast: if the expected earnings do not arrive, that 17.3 goes back to being 29.5.
- How the number is calculated matters. Past or expected earnings, losses included or excluded, weighted or simple average: the same group of companies can cost 16.7 or have no meaningful P/E at all. Before comparing two numbers you need to know whether they were calculated the same way.
- Valuation says little about next year. An expensive market can become more expensive, a cheap one can stay cheap for a long time. The price of earnings says something about the expectations built in today, not about when they will change.
What it means for investors
- The whole market is already diversified: American or global, it holds thousands of companies, including those nobody is watching today.
- Buying only large US companies is a specific choice: it means concentrating on the most expensive part of the market, the one most driven by passive fund flows, where the top ten companies are worth more than a third of the total.
- The whole world is still two thirds America: anyone who wants a different weight has to choose it deliberately, not take it for granted.
- Going broader changes the risk, not just the price: small companies swing more and are more often loss-making, and outside the United States currencies come into play.
- A P/E is read together with its method: always ask whether it counts losses and whether it looks at the past or at estimates.
This article is for information only and does not constitute financial advice: tax rules and investor protection vary from country to country, and every decision should be assessed against your own situation.
In summary
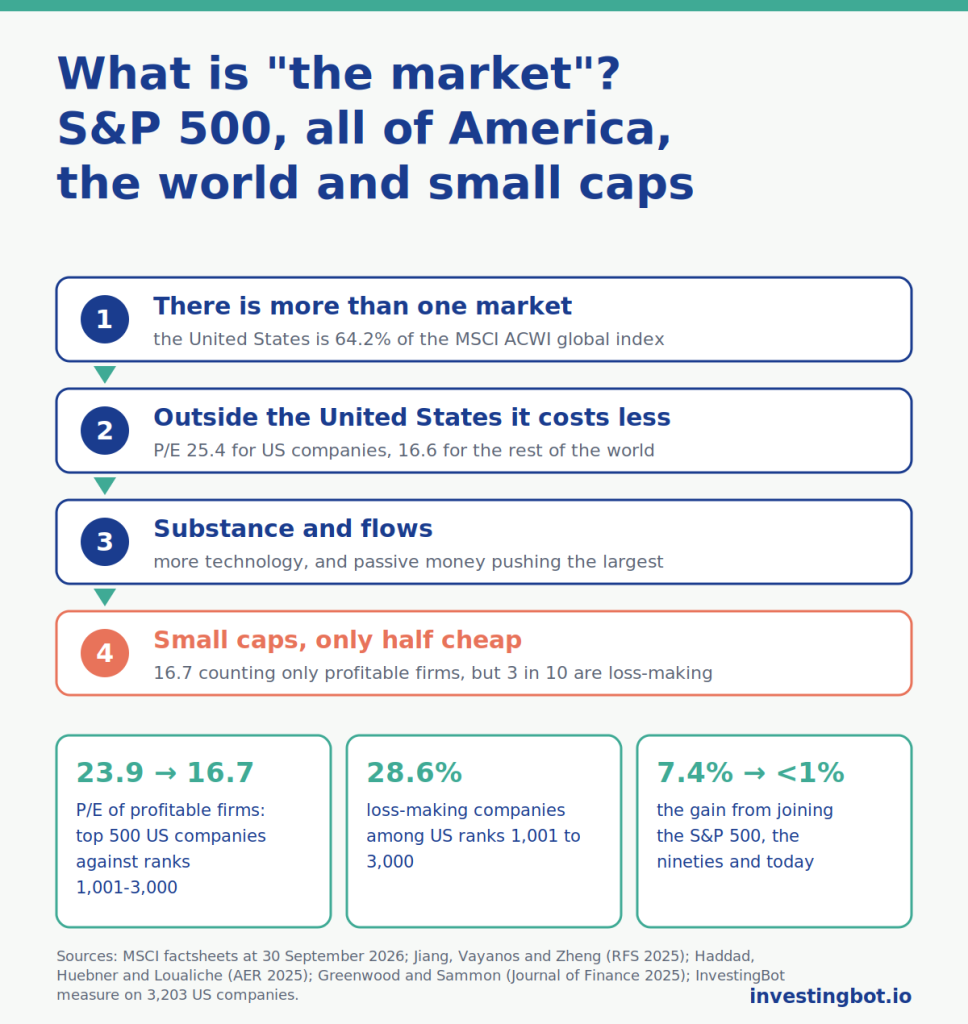
- “The market” is not just one thing: US large caps, the whole US market, the world, the world excluding the United States and small companies are different baskets.
- At the end of September 2026 the United States made up 64.2% of the MSCI ACWI global index and 63.0% of the one including small companies.
- According to MSCI, US large and mid caps cost 25.4 times the earnings of the last 12 months, the whole world 21.4, the world excluding the United States 16.6.
- Part of the gap comes from composition: technology weighs 39.5% in America and 21.9% in the rest of the world.
- Part comes from flows: passive funds push the largest companies harder (Jiang, Vayanos and Zheng, 2025) and have made demand for individual stocks 11% more inelastic (Haddad, Huebner and Loualiche, 2025).
- The gain of a stock just added to the S&P 500 has fallen from 7.4% in the nineties to less than 1% (Greenwood and Sammon, 2025).
- In our measure, counting only profitable companies, the P/E falls from 23.9 for the top 500 US companies to 16.7 for those ranked 1,001 to 3,000, but among the latter almost three in ten are loss-making and the losses almost cancel out the earnings.
What does “the market” mean?
Usually an index, that is, a list of companies chosen by precise rules. It can be the S&P 500, the whole US market, the world or the world excluding the United States, with or without small companies. They are different baskets, with different prices and risks.
Is the S&P 500 the whole US market?
No, it is the large company part of it. According to MSCI, large and mid-sized US companies cover about 85% of stock market value, and the 1,669 small ones about 14%. There are many of them, but they weigh little: this is why an index of large companies and one of the whole market move in similar ways.
How much do the United States weigh in the global market?
About two thirds. At the end of September 2026 they made up 64.2% of the MSCI ACWI global index and 63.0% of its version including small companies. Anyone who buys a fund on the whole world is therefore investing almost two thirds in America.
Why are US stocks more expensive than those in the rest of the world?
Partly because of composition: in America technology makes up 39.5% of the index, in the rest of the world 21.9%, and technology companies have on average higher margins and growth. Partly because of flows: index fund money flows above all into the largest companies, which are largely American.
Do passive funds inflate the prices of the largest companies?
According to Jiang, Vayanos and Zheng (Review of Financial Studies, 2025), flows into passive funds push up precisely the shares of the largest companies more, especially those already overvalued. Haddad, Huebner and Loualiche (American Economic Review, 2025) estimate that the growth of passive management has made demand for individual stocks 11% more inelastic, so the same flow of money moves prices more.
Are small companies cheaper?
Only halfway. In our measure, counting only profitable companies, those ranked 1,001 to 3,000 cost 16.7 times earnings against 23.9 for the top 500. But almost three in ten are loss-making, and adding losses to earnings the group barely earns anything. On expected earnings they become cheap again, but only if the estimates come true.
Is it better to buy the whole world or just the S&P 500?
It depends on what you want to own. Only the S&P 500 means concentrating on large US companies, the most expensive part and the one most driven by flows; the whole world adds other countries, currencies and sectors, but remains two thirds America. Going broader changes the risk as well as the price: it is a choice to make knowing what is inside.