



Buying a single US stock has become as easy as ordering dinner: an app, a few seconds, no visible commission. Among the stocks most traded by small investors there are often microcaps worth a few tens of millions of dollars, freshly listed companies, names that jump 40% in a morning after a social media post. Next to them, almost every day, law firms announce class actions over allegedly false financial statements or broken promises. A question comes naturally: is this investing or betting? And who really sets the price, the millions of small savers or the big funds?
Academic research and official statistics give surprisingly clear answers. On average the small investor who picks individual stocks does worse than the index: trades too much, diversifies too little, is drawn to stocks that look like lottery tickets and buys whatever is in the news. The market itself is built in a way that punishes picking a few names, because almost all wealth comes from a small minority of companies. Accounting fraud is more widespread than what surfaces, and when it surfaces the victims recover little. Finally, on the market’s scale, small investors weigh more than people think as owners, but prices are moved mostly by institutional flows; small investors really count when they all move together, and usually not to their own advantage. This article lines up the evidence, with the names of those who gathered it, and a measure taken on our own data.
What small investors do: thirty years of real accounts
The first study to look inside the real accounts of savers is still the starting point. Brad Barber (then at the University of California, Davis) and Terrance Odean (now Rudd Family Foundation Chair at the Haas School of Business, UC Berkeley), in “Trading Is Hazardous to Your Wealth” (Journal of Finance, 2000), followed 66,465 households at a large US broker from 1991 to 1996. The average household turned over 75% of its portfolio every year. Those who traded most earned 11.4% a year, against 17.9% for the market index and 18.5% for those who traded little. Before costs the choices were worth roughly the same: commissions, spreads and trading frequency made the difference. The authors explain it with overconfidence: those who believe they can pick trade more, and pay more.
The second trait is poor diversification. William Goetzmann (Edwin J. Beinecke Professor at the Yale School of Management) and Alok Kumar (Gabelli Chair at the Miami Herbert Business School), in “Equity Portfolio Diversification” (Review of Finance, 2008), analysed more than 40,000 accounts: most investors held few stocks, often highly correlated with each other. The least diversified were low-income investors, non-professionals and young frequent traders. It was not a matter of money or costs: poor diversification went hand in hand with overconfidence, trend chasing and a preference for companies close to home. And on average it cost return.
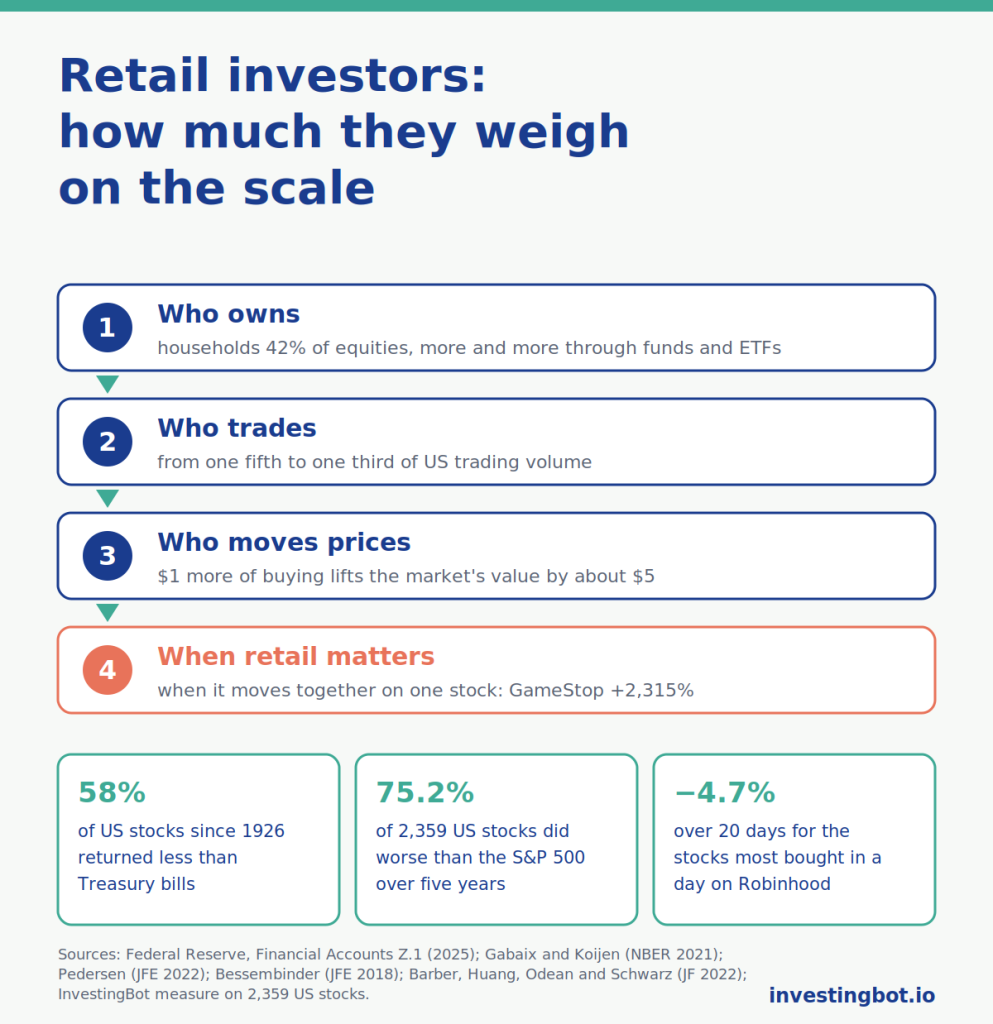
The third trait is attention. Zero-commission apps amplified the phenomenon, and research measured it with new data. Barber, Xing Huang, Odean and Christopher Schwarz, in “Attention-Induced Trading and Returns: Evidence from Robinhood Users” (Journal of Finance, 2022), found that Robinhood users herd into the stocks that land in the spotlight, and that the stocks they buy most on a given day return on average −4.7% relative to the market over the next 20 days. According to the authors the design of the app matters too, not only the inexperience of its users. Barber, Shengle Lin and Odean, in “Resolving a Paradox: Retail Trades Positively Predict Returns but Are Not Profitable” (Journal of Financial and Quantitative Analysis, 2024), solved a puzzle: small investors’ purchases partly anticipate returns, yet on average they do not make money, because they concentrate on attention-grabbing stocks. Among the stocks most traded by small investors, a strategy built on their buying imbalances lost 14.8% a year.
In the extreme case, day trading, the verdict is even harsher. Barber, Yi-Tsung Lee, Yu-Jane Liu and Odean (“The Cross-Section of Speculator Skill: Evidence from Day Trading”, Journal of Financial Markets, 2014) used the complete data of the Taiwan stock exchange from 1992 to 2006: less than 1% of day traders manage to earn predictably and consistently after fees.
The opposite view, which deserves a hearing
An honest picture must include the studies pointing the other way. The economist Ivo Welch, in “The Wisdom of the Robinhood Crowd” (Journal of Finance, 2022), rebuilt the aggregate portfolio of Robinhood users between mid-2018 and mid-2020: in the crash of March 2020 they bought instead of selling, and that combined portfolio had good timing and an above-expected return. It is a real result, but it has to be read correctly: it concerns everyone’s portfolio taken together, tilted towards large and heavily traded stocks, not the single saver with five stocks. Likewise Ekkehart Boehmer, Charles Jones, Xiaoyan Zhang and Xinran Zhang (“Tracking Retail Investor Activity”, Journal of Finance, 2021) showed that stocks net-bought by small investors do about 0.10% better over the following week: a small but genuine piece of information. None of these studies says that small investors are naive by definition; they say that, on average, the way they trade costs more than it earns.
Stocks as lottery tickets
Why do so many investors choose microcaps and the most volatile stocks? Alok Kumar, in “Who Gambles in the Stock Market?” (Journal of Finance, 2009), studied about 70,000 investors. He defined as “lottery-type” the stocks priced below 5 dollars, highly volatile and with a history of extreme gains: a small outlay, a small chance of a huge payoff. The result is an almost sociological portrait. The same characteristics that make people spend more on state lotteries make them invest more in these stocks; demand for them rises in recessions, just like demand for tickets; and on average they return less, with the heaviest losses for low-income investors who overweight them.
Turan Bali, Nusret Cakici and Robert Whitelaw, in “Maxing Out: Stocks as Lotteries and the Cross-Section of Expected Returns” (Journal of Financial Economics, 2011), found the trace in prices: the stocks with the strongest one-day gain in the previous month return less in the following months. The market charges dearly for the dream of the big win. A later paper published in the Critical Finance Review in 2022 attributes the effect more to overreaction than to lottery seeking; for investors the substance does not change.
At the edges of the market the dream meets manipulation. A team led by Christian Leuz (Chicago Booth), with Steffen Meyer, Maximilian Muhn, Eugene Soltes and Andreas Hackethal (“Who Falls Prey to the Wolf of Wall Street? Investor Participation in Market Manipulation”, NBER, 2017), studied 470 “pump and dump” schemes, the campaigns in which someone inflates a stock with false promises and then sells. In the accounts of more than 110,000 clients of a large German bank, almost 8% of active investors had taken part in at least one scheme, losing about 30% on average. And not all of them were naive: some sought the schemes out on purpose, hoping to get out before the others. Ulf Brüggemann, Aditya Kaul, Christian Leuz and Ingrid Werner (“The Twilight Zone: OTC Regulatory Regimes and Market Quality”, Review of Financial Studies, 2018), on more than 10,000 US stocks traded outside regulated exchanges, measured the effect of the rules: fewer disclosure obligations mean less liquidity and more crash risk.
Why picking a few stocks is statistically an uphill climb
If the small investor often gets it wrong, it is tempting to think that choosing better is enough. The most cited study of recent years shows that the difficulty lies in the very structure of the market. Hendrik Bessembinder (Arizona State University, holder of the Francis J. and Mary B. Labriola Endowed Chair), in “Do Stocks Outperform Treasury Bills?” (Journal of Financial Economics, 2018), followed almost 26,000 US stocks since 1926. 58% returned less than one-month Treasury bills over their life on the exchange. All the wealth created by the US stock market above Treasury bills, about 35,000 billion dollars, comes from 1,092 companies, 4.3% of the total; more than half from just 90.
The consequence is counterintuitive. The market as a whole returns a lot, but the typical stock does not: returns are skewed, with a few enormous winners and a long tail of mediocre or losing stocks. Whoever buys the index owns those few winners by construction. Whoever picks five stocks has a good chance of catching none of them, and the average of their results is lower than the market’s even without any error of judgement.
It is not only an amateur problem. The SPIVA report by S&P Dow Jones Indices, which every year measures professional managers against their benchmarks, counted at the end of 2024 65% of active US large-cap funds behind the S&P 500 in a single year; over 15 years, in no category did the majority of managers beat their benchmark. And fund investors add a cost of their own: the “Mind the Gap” study by Morningstar, over the ten years to the end of 2024, estimated that investors earned about 1.2 points a year less than the funds they owned, because they buy and sell at the wrong moments.
Fraud and class actions: how big the hidden risk is
The class action notices that appear every day are not background noise. Alexander Dyck (Rotman School of Management, University of Toronto), Adair Morse (Haas School of Business, UC Berkeley) and Luigi Zingales (Chicago Booth), in “How Pervasive Is Corporate Fraud?” (Review of Accounting Studies), estimated how much fraud stays hidden using a natural event: the fall of Arthur Andersen, which forced thousands of companies to change auditor and brought to light irregularities that would otherwise have stayed buried. Their estimate is that every year about 10% of large US listed companies commit securities fraud (with a range between 7% and 14%), and that in normal times only a third is detected. The total cost is of the order of 1.6% of equity value a year.
When fraud surfaces, lawsuits follow. According to Cornerstone Research, which publishes the reference statistics on class actions every half year, 114 federal securities class actions were filed in the first half of 2025, and the yearly probability that a company listed on a US exchange faces one is around 4%; in the first half of 2026 filings rose to 121, 30% more than in the previous half year. But a lawsuit is not a refund. In 2024 the median settlement was about 14 million dollars, around 7% of the losses estimated by the plaintiffs themselves, and after years of waiting. Whoever bought a rigged stock recovers, at best, a small fraction of what they lost.
An important caution, valid for every reader: a law firm notice is an allegation, not a ruling. Many firms publish dozens of identical notices about the same company to gather clients, and part of the cases are dismissed. The useful signal is another one: if a company often appears in these lists, the risk its buyers take on is higher than average, and it is worth knowing before.
The market’s scale: who weighs more, small investors or institutions?
Imagine the US stock market as a scale, with small investors on one pan and institutions on the other: mutual funds, ETFs, pension funds, insurers, foreign investors. The answer depends on what is weighed: who owns, who trades or who moves prices. They are three different scales, and they give three different results.
First scale: who owns the shares
The financial accounts of the Federal Reserve (table L.224 of the “Financial Accounts of the United States”) say who holds corporate equities, listed and unlisted. At the end of 2025 the total was worth 111,355 billion dollars. Households held 47,186 billion directly, about 42%: it is the largest item, and it also includes stakes in unlisted companies and foreign shares owned by Americans, so it is a broad measure. Foreign investors held 20,455 billion (about 18%), mutual funds 17,098 (about 15%), ETFs 10,760 (about 10%), private and public pension funds almost 9,900 (about 9%).
On this pan small investors seem to weigh a great deal. But two corrections change the reading. The first: a growing share of household savings goes through funds and ETFs, and there the managers vote and decide. According to Morningstar, at the end of 2023 US index funds overtook active funds in assets for the first time, about 13,300 billion against 13,200. The second: ownership is highly concentrated. Lucian Bebchuk (Harvard Law School) and Scott Hirst (Boston University), in “The Specter of the Giant Three” (Boston University Law Review, 2019), measured that the average stake of BlackRock, Vanguard and State Street in S&P 500 companies went from 5.2% in 1998 to 20.5% in 2017, and that the three together cast about 25% of the votes at shareholder meetings. Millions of small shareholders, divided, weigh far less than three managers voting as a block.
Second scale: who trades
On trading volume estimates diverge, because most small investors’ orders do not go through the exchanges but through the large intermediaries that execute them internally. The most cited measures put the small investors’ share at around 18% of US equity volume in 2024, with estimates between 20% and 25% in the most agitated months of 2025; the MEMX exchange, which also sees part of those orders, estimates between 30% and 37% depending on the day. The solid figure is the order of magnitude: from a fifth to a third of trading. The rest is funds, intermediaries and high-frequency algorithms.
Third scale: who moves prices
Here recent research has changed the way the market is seen. Xavier Gabaix (Pershing Square Professor of Economics and Finance at Harvard) and Ralph Koijen (Chicago Booth), in “In Search of the Origins of Financial Fluctuations: The Inelastic Markets Hypothesis” (NBER, 2021), estimated that every extra dollar investors move into equities raises the total value of the market by about 5 dollars. The mechanism is this: all the shares already exist, and whoever wants to buy them has to find someone willing to sell. But much of the capital is held by institutions with rigid mandates, such as index funds or pension funds that must keep a fixed share in equities, and they sell little even when prices rise: the market is “inelastic”. To find sellers the price has to rise a lot, by about 5% for purchases equal to 1% of the market’s value, and the new price applies to all shares, not only to those that changed hands. The 5 dollars are value on paper, not money flowing in: the dollar of the purchase goes to the seller, and the rest is the revaluation of everyone else’s shares. It also works in reverse, when money flows out. It follows that flows matter much more than classical theory said, and that large flows, those of institutions and of the funds into which savings pour, are the ones that shift the level of the market.
Small investors, on their own, weigh little on this scale. They become decisive when they all move in the same direction on the same stock. The textbook case is GameStop in early 2021, studied by Lasse Heje Pedersen (Copenhagen Business School) in “Game On: Social Networks and Markets” (Journal of Financial Economics, 2022): word of mouth on social networks sent the stock up 2,315%, yet at its peak it was worth just 0.07% of the US stock market. Small investors can overturn the price of a single stock, especially if it is small and heavily shorted; they do not move the market. And their herd behaviour has a cost for everyone: Gregory Eaton, Clifton Green, Brian Roseman and Yanbin Wu (“Retail Trader Sophistication and Stock Market Quality: Evidence from Brokerage Outages”, Journal of Financial Economics, 2022) observed that when Robinhood was down because of an outage, the stocks most loved by its users became less volatile and more liquid.
The scale’s verdict
As owners, small investors weigh a great deal, but fragmented and largely through funds managed by others. As traders, they account for a fifth to a third of trading. As a force on prices, they count little individually and a lot when they move together, and they do so mostly on small, volatile stocks in the spotlight: exactly the ones where studies find the worst returns. The level of the market is driven by the big flows; individual stories, for better or worse, can be driven by small investors.
Our measure: five years of US stocks
We redid Bessembinder’s calculation on a small scale, on our universe of US stocks, with prices adjusted for dividends and splits: five years of trading sessions, from October 2021 to October 2026. In the same period the S&P 500 (measured with the SPY ETF) returned 86.8%. Of the 2,359 stocks listed for all five years, 75.2% did worse than the index and 40.1% lost money. The median return was 20.8%, the average 54.5%: the gap between the two is exactly the skew in the studies, a few stocks that soar lift the average, while the typical stock lags far behind.
The measure has a limit that must be stated, and it favours individual stocks: it includes only companies still listed after five years. Those that went bankrupt, were bought at a discount or were delisted in the meantime are missing, and would have worsened the numbers. We also excluded about 380 stocks with suspicious price jumps, usually reverse splits not recorded correctly in the history.
A second figure comes from the forms that executives and directors must file with the SEC when they buy or sell shares of their own company. Among US stocks with at least one open-market trade in the last twelve months, in 76.5% of cases insiders sold more than they bought. It is not an alarm: those paid in shares sell to diversify or to pay taxes, and the literature considers purchases made with one’s own money far more informative. But it is a reminder of something simple: those who know a company best, in the vast majority of cases, are not buying more of it.
What changes for investors
- The core of the portfolio can be the index: the skewed structure of returns means that owning them all is, by construction, the simplest way to also own the few big winners.
- A single stock is a choice, not a bet, only if you know why you buy it: a written hypothesis, a price you consider reasonable, a reason why the market has not yet understood it. If the reason is “everyone is talking about it”, studies say you are late.
- Be wary of lottery-type stocks: low price, extreme volatility, sudden jumps. They return less than average precisely because they attract those who dream of the big win.
- Trade less: every trade has a cost, and overconfidence is the best documented flaw in personal finance.
- Look at legal and accounting risk before buying: companies with frequent class action notices, insiders selling non-stop or financial statements hard to read carry a risk the price does not always show.
On InvestingBot every company page gathers on a single line the law firm notices about the same company, with the dates and the period indicated by the class action, and the “Explain what is happening” button presents them for what they are: allegations, not rulings. The “Analysts & positioning” box puts next to the analysts’ average rating the balance of insider purchases and sales, from SEC forms. Why frequent trading costs money is told in the article on what holds up in technical analysis; why timing is almost impossible, in the one on market timing.
This article is for information only and is not financial advice: tax rules and investor protection vary from country to country, and every choice should be assessed against one’s own situation.
In brief
- Across 66,465 US households, those who traded most earned 11.4% a year against 17.9% for the market (Barber and Odean, 2000).
- Most small investors are poorly diversified, and poor diversification costs return (Goetzmann and Kumar, 2008).
- The stocks Robinhood users buy most on a given day return on average −4.7% over the next 20 days (Barber, Huang, Odean and Schwarz, 2022); less than 1% of day traders earn consistently.
- “Lottery-type” stocks attract mainly low-income investors and return less than average (Kumar, 2009).
- 58% of US stocks returned less than Treasury bills over their life; all the market’s net wealth since 1926 comes from 4.3% of companies (Bessembinder, 2018).
- About 10% of large listed companies commit securities fraud every year, and only a third is detected (Dyck, Morse and Zingales); class action settlements are worth, at the median, around 7% of estimated losses.
- On the market’s scale small investors own a lot and make up a fifth to a third of trading, but prices are moved mostly by institutional flows (Gabaix and Koijen); small investors count when they move together on one stock.
- On our data, over five years 75.2% of 2,359 US stocks did worse than the S&P 500 and 40.1% lost money.
Do small investors beat the market?
On average, no. Studies on tens of thousands of real accounts find that those who pick individual stocks and trade often earn less than the index, mainly because of costs and the tendency to buy what is in the news. There are exceptions and favourable periods, but they concern a minority.
Why is it so hard to pick the right stocks?
Because returns are highly skewed: according to Bessembinder most stocks return less than Treasury bills, and almost all wealth comes from a small minority of companies. Those who buy few stocks have a good chance of missing the big winners.
Are microcaps an investment or a bet?
It depends on how they are bought. Statistically, low-priced, highly volatile stocks with sudden jumps return less than average and are more exposed to manipulation. They can make sense only with serious analysis and a small share of one’s wealth.
How many listed companies commit accounting fraud?
According to the estimate by Dyck, Morse and Zingales, about 10% of large US listed companies commit securities fraud every year, and in normal times only a third of these cases is detected.
Will a class action give me back the money I lost?
Rarely in full. Settlements arrive after years and are worth, at the median, a small part of the estimated losses, around 7% according to Cornerstone Research statistics. A law firm notice, moreover, is an allegation and not a ruling.
Who really moves prices, small investors or institutions?
The level of the market is moved mostly by the large flows of institutions and funds: according to Gabaix and Koijen every extra dollar moved into equities raises the total value of the market by about five, because those who own shares sell little and the new price applies to all shares, not only to those bought. Small investors weigh a lot as owners and account for a fifth to a third of trading, and become decisive when they move together on a single stock, as in the GameStop case.
Is it better to buy an ETF instead of individual stocks?
For the core of the portfolio studies give a clear advantage to the index: diversification, low costs and the certainty of also owning the few stocks that deliver most of the return. Individual stocks can sit alongside it, with a precise reason and without replacing it.