



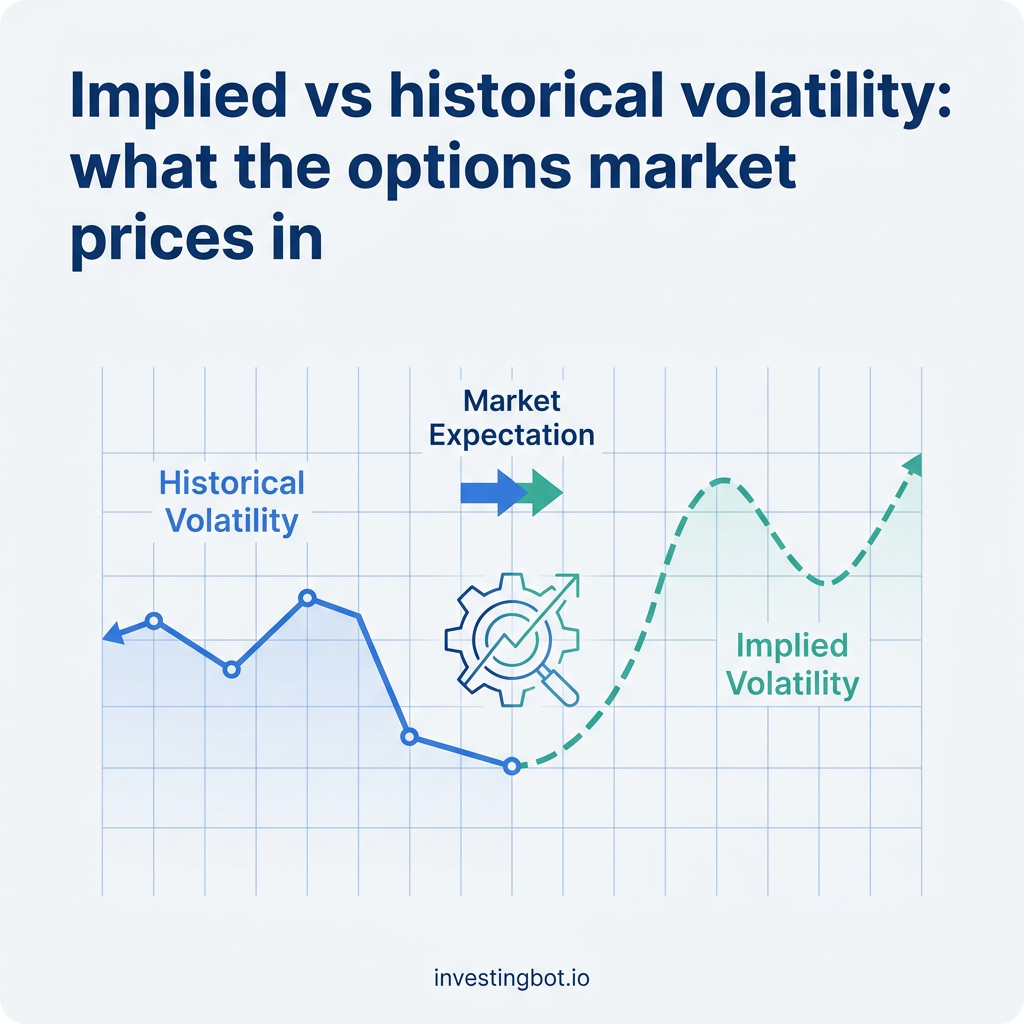
Historical volatility measures how much a stock has moved in the past; implied volatility measures how much the options market expects it to move in the future. The first is computed from prices that have already happened, the second is derived from options prices and is, in essence, a collective forecast of the risk ahead. That is the whole distinction: one looks backward, the other looks forward — and precisely because it looks forward, implied volatility already prices in known-but-not-yet-happened events, such as an upcoming earnings report. Understanding it tells you how much risk the market is genuinely pricing into a stock today, not how much it carried yesterday.
It sounds like a technical detail, but it changes the way you read a chart. When people say “the stock is volatile,” they almost always mean historical volatility: a measured fact. But when you want to know what could happen now — how much it might move ahead of an announcement, how expensive protection is, how nervous the market is — you need implied volatility. They are two different lenses on the same stock, and confusing them leads to the wrong conclusions.
Historical volatility: the movement of the past
Historical (or “realized”) volatility is the statistical measure of how much a stock’s price has fluctuated over a given period. Technically it is the standard deviation of daily returns, annualized to make it comparable. A stock with 20% historical volatility has moved, on average, far less than one at 60%.
The virtue of historical volatility is that it is objective and verifiable: it is computed from prices that were actually recorded, not from an opinion. Its limitation is just as sharp: it only looks backward. It tells you how the stock behaved over the last month or the last year, but it knows nothing about what is about to happen. If earnings are tomorrow, a management change, or a rate decision, historical volatility does not “see” them: it keeps describing the past as if the future were a carbon copy of it.
Implied volatility: what the options market prices in
Implied volatility is a different animal. It is not measured from the stock’s prices but derived from the prices of the options written on that stock. An option is a contract granting the right to buy (call) or sell (put) at a set price by an expiry date: the more the market expects the stock to move, the more that right is worth, and the more the option costs. By running the process in reverse — from the option’s price back to the volatility that justifies it — you obtain the volatility implied in those prices: precisely the one the market is pricing.
This is why implied volatility is a forward-looking indicator. It is not a passive measure of the past, but the synthesis of what thousands of participants are willing to pay, with real money, to protect themselves or bet on future moves. When implied volatility rises, the market is saying “I expect turbulence”; when it falls, “I expect calm.” And crucially: because it is a forecast, it automatically incorporates the events already on the calendar.
The difference that matters: looking forward or looking back
The case of earnings reports
The clearest example is earnings season. Picture a stock that has moved little over the past month: its historical volatility is low, say 25% annualized. But earnings are a few days away — a binary event that can jolt the price in either direction. The options market knows this and prices protection dearly: implied volatility can climb to 40% or more. The two measures diverge precisely because one has already “discounted” the event and the other has not.
Someone looking only at historical volatility would see a quiet stock. Someone looking at implied volatility understands that the market expects a significant move. It is the same stock, read with two tools that say opposite things — and in that moment it is implied volatility that is right, because it is the only one incorporating the imminent earnings report.
The “volatility crush” after the announcement
There is a corollary that surprises newcomers to options. Once earnings are out and the uncertainty dissolves, implied volatility collapses at once: the phenomenon is called volatility crush. The “expected” risk has become “realized,” so the market stops paying for it. This is why buying protection (or betting) right before an event is often a worse deal than it looks: you pay the high implied volatility, and even if the stock moves, the collapse in volatility after the announcement can devour the gain. A detail that historical volatility, on its own, could never flag for you.
The expected move: how much the market expects the stock to move
From implied volatility comes a very practical number: the expected move (or implied move) around an event. Looking at how much a call and a put at the same expiry near the current price cost together, the market effectively declares: “I expect the stock to move by about ±X% on this earnings report.” It does not say in which direction — only the likely size of the swing.
It is valuable information for calibrating your expectations. If the expected move around an event is ±6% and you believe the stock could do far more or far less, you are implicitly taking a position against the market — and it is worth knowing how much that market is already pricing you. But mind the boundary: the expected move is an amplitude, not a prediction of direction, and it is not an annualized volatility either. They are different quantities that are easy to confuse.
The premium: implied versus realized
Comparing implied volatility with the one that actually materializes reveals one last useful thing. Historically, on the major indices implied volatility tends to run a little higher than realized volatility: it is the “premium” that whoever sells protection collects for bearing the risk, much like insurance that on average costs more than the damage it covers. When instead implied volatility is lower than the volatility that follows, it means the market had underestimated the turbulence ahead.
The ratio between the two measures thus becomes a thermometer: implied well above realized signals that the market is pricing more movement than usual (often ahead of an event or in a climate of fear); implied in line or below signals complacency, priced-in calm. In moments of stress — when markets crash — volatility explodes and protection becomes expensive exactly when it is needed most, a mechanism we described when writing about how to defend yourself in a bear market.
How we use volatility in our tools
On a stock’s analysis page we show a projection cone: a statistical fan that, starting from volatility, draws the range within which the price could swing over the coming weeks. Here we apply exactly the distinction of this article, and we state it openly to the user.
When the options market is open and liquid, the cone uses implied volatility — the forward-looking one, which already incorporates an upcoming earnings report. When the options market is closed, or for stocks that have no options market (the case with many European equities), the cone falls back on historical volatility: a solid figure, but with the limit you now know — it does not “see” imminent events. The label always states which of the two it is using, because a range built on implied volatility and one built on historical volatility tell different stories, and hiding that would be dishonest.
And there is one caveat we repeat everywhere, because it is the most common misunderstanding: the cone is a range of oscillation, not a prediction of direction. It tells you how much the stock could move, not whether it will rise or fall. No serious tool claims to know the direction; knowing the likely amplitude, however, is already a concrete advantage for sizing a position and not being caught off guard by the normal swing.
In summary
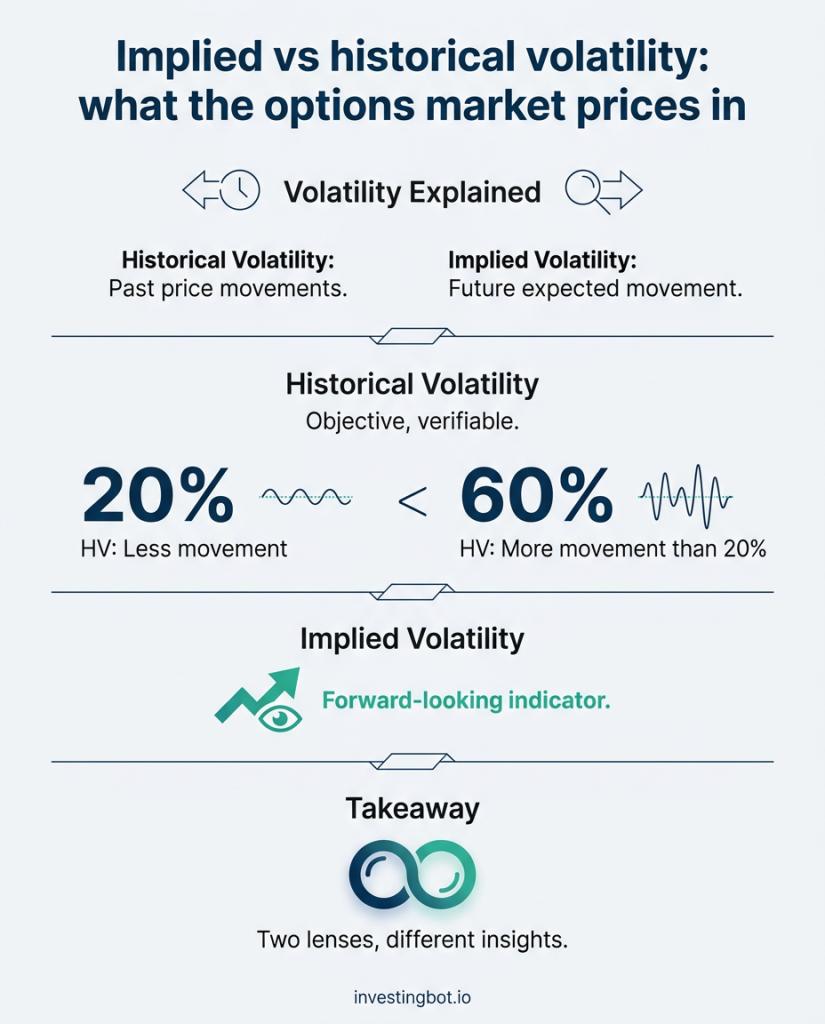
- Historical volatility: how much a stock has moved in the past. Objective, but it only looks backward.
- Implied volatility: how much the options market expects it to move in the future. It is a forecast, and it already incorporates known events on the calendar (such as earnings reports).
- Ahead of an event, implied rises above historical; after the announcement it collapses (volatility crush).
- The expected move is the amplitude (±X%) the market prices around an event — not a direction, not an annual volatility.
- Our projection cone uses implied when available, historical otherwise, and always states which: it remains a range of oscillation, never a prediction of direction.
Frequently asked questions
What is implied volatility?
It is the future volatility the market is pricing into a stock, derived from the prices of its options. The more the options cost, the greater the move the market expects. Unlike historical volatility, which measures the past, implied volatility looks ahead and also reflects known-but-not-yet-happened events.
Why does implied volatility rise before earnings?
Because an earnings report is a binary event that can sharply move the price. The market knows this and pays more to protect itself or bet, pushing up the cost of options and therefore implied volatility. After the announcement, with the uncertainty resolved, implied typically collapses (volatility crush).
Does implied volatility tell you whether the stock will go up or down?
No. It only indicates how much the market expects the stock to move, not in which direction. High implied volatility signals a likely large move, which can happen either upward or downward. Whoever sells protection, even at a high premium, is not betting on direction but on amplitude.
What is the difference between implied volatility and the VIX?
The VIX is, in practice, the implied volatility of an entire benchmark equity index, computed from its options and used as the market’s overall “fear gauge.” The implied volatility we discuss here is the same concept applied to the single stock: it measures the expected uncertainty on that specific equity, not on the whole market.
This article is for purely informational and educational purposes and does not constitute personalized financial advice or a recommendation to buy or sell financial instruments. The numerical values cited are illustrative examples.