



![Cover [EN] — How to Defend Yourself in a Bear Market (And Why Stock Picking Isn't Enough)](https://investingbot.io/wp-content/uploads/2026/07/cover-en-how-to-defend-yourself-in-a-bear-market-and-why-stock-picking-isnt-enough-ua4J0.png)
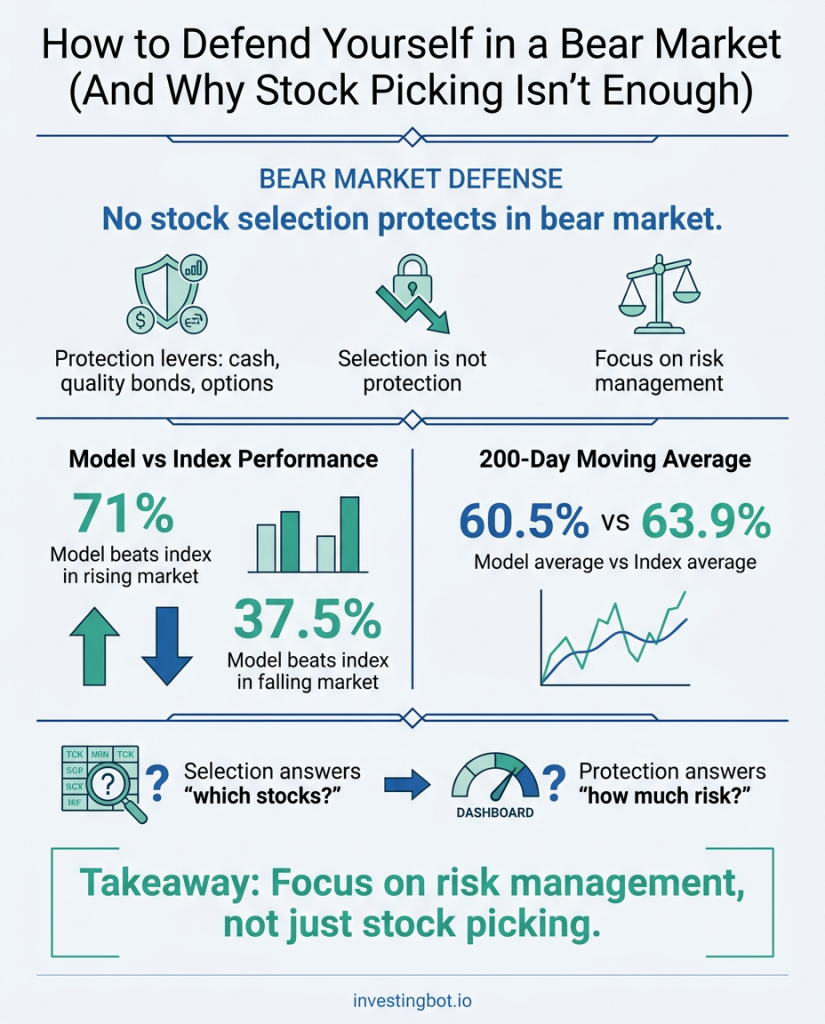
In a bear market, there is no stock selection model that protects a portfolio. The only real protection levers are three: reducing exposure (cash), holding quality bonds with adequate duration, or buying an explicit hedge with options. Everything else—picking “the best stocks,” rotating into defensive sectors, entering and exiting based on a trend signal—is selection, not protection.
This isn’t just an opinion: it’s what we found by measuring our own selection model over fourteen years of market history. The results forced us to change the way we present it. It’s worth sharing, because it’s exactly the kind of analysis that almost no one publishes.
What we measured, and why it surprised us
We have a model that ranks US stocks by attractiveness and divides them into ten groups. On paper, it works: the leading group beats the index in 71% of months. It’s a number that, on its own, would make a sales pitch headline.
Then we separated the months in which the market rose from those in which it fell. The picture changed completely:
- When the market rises, the leading group beats the index in ~71% of the months. The advantage is real.
- When the market drops, the percentage drops to 37.5% — and the gap reverses: the worst-performing group outperforms the best-performing group.
In translation: what appeared to be a selection advantage was largely a bias toward high-volatility, high-momentum stocks. A bias that pays handsomely as the market rises, and presents the bill when it falls. This isn’t a flaw in our particular model; it’s the nature of most price-and-momentum signals.
And what about market timing? That doesn’t hold up to the test either.
The instinctive reaction is: “Then just exit the market when the trend turns.” We tried this too, with the most common rule of thumb: stay invested above the 200-day moving average and exit below it.
The result was worse than simply staying invested: 60.5% versus 63.9%. The reason is instructive. The 200-day moving average is slow: when it signals “down,” the crash has often already occurred, and what follows is the recovery phase—precisely the phase in which the most volatile stocks rebound most strongly. The signal causes exits to be delayed and re-entries to be even later.
We also tested the opposite hypothesis, that is, using the reverse signal during declines. We can see something in past data, but it’s not replicable in reality: to apply it, you would need to know in advance that you’re in a bear market, which is precisely the information you never have at the right time.
A selection model answers the question “which stocks perform better than others.” It doesn’t answer the question “how much risk do I want to take on?” These are two different decisions, and only the second one protects.
The trap of waiting in cash
There’s a mistake that seems like caution but is almost always costly: stopping contributions or selling while waiting for a drop that “is yet to come.”
Research on the topic—including that of Vanguard and analyses published by Nick Maggiulli—shows a counterintuitive result: waiting for a downturn while sitting in cash loses out to steady investing in the vast majority of historical periods. And the most disconcerting finding is that it loses even assuming you know the exact lows in advance. The reason is simple: while you wait, the market often rises, and the downturn—when it comes—starts at a higher level than the one at which you exited.
It’s worth adding a detail that’s usually overlooked: the damage doesn’t come from contributing less, but from exiting. Temporarily reducing an accumulation plan has a modest cost; selling already accumulated shares to re-enter “lower” is the decision that really weighs, because that re-entry requires being twice right—about the exit timing and the return timing.
The three levers that really protect
1. Cash: the only total protection
Reducing equity exposure is the only measure that works reliably in any type of downturn, because it doesn’t depend on correlations or counterparties. Its cost is equally certain: if the downturn doesn’t materialize—and this is the most common case—you forgo returns in the meantime. It’s a risk profile choice, not a forecast: it makes sense if the cash allocation is decided ahead of time, as part of the portfolio structure, not improvised after a difficult week.
2. Bonds: Effective in recessionary downturns, not inflationary downturns
Quality government bonds with adequate duration tend to rise precisely when stocks fall, if the decline is driven by recession fears and flight to safety. This is classic behavior, and it’s why the balanced portfolio has worked for decades.
The caveat must be stated clearly, because it is recent and has caught many unprepared: when the decline is driven by inflation and rising interest rates, stocks and bonds fall together. In that case, traditional diversification has failed to protect. Bonds remain a serious lever, but they cover one type of crisis, not all.
3. Hedging with options: the only one that pays exactly when you need it
Buying explicit protection—a put on the index, a collar designed to reduce its cost, a hedge against extreme events—is the only mechanical solution: its value increases when the market crashes, by construction, without depending on how other assets behave.
Price is its main feature, not a side effect: you pay a premium regularly, and in most periods, that premium is lost. It’s an insurance expense, and should be evaluated as such—knowing that it requires more operational expertise than the other two levers.
How to read analytics tools, then
From this review, we drew a practical consequence for our product: the selection tools—scores, scanners, sector analyses—are presented for what they are, that is, tools for normal or rising markets. They serve to answer the question, “Which of these stocks have the best characteristics?” They are not, and are not sold as, downside protection.
The caveat is written in the interface itself, next to the score: anyone who reads it knows that that number behaves differently depending on the market regime. We prefer a user who understands the limitations of a tool to one who believes they have protection they don’t have.
In summary
- Stock selection models work in rising markets and tend to worsen portfolio behavior in falling markets.
- Trend-based exit rules, including the 200-day moving average, performed worse than remaining invested.
- Waiting for the downturn while sitting in cash is historically a losing proposition, even when knowing the lows in advance.
- The only protection levers are cash, quality bonds, and explicit hedging: these are part of portfolio construction, not stock selection.
- The protection level should be decided when the markets are calm. Deciding it during a crash is almost always a bad decision.
Frequently Asked Questions
What exactly is a bear market?
By convention, a bear market is defined as an index losing at least 20% from its previous highs. This is an arbitrary but useful threshold, as it distinguishes an ordinary correction—frequent and natural—from a prolonged downturn, which typically lasts several months and changes the behavior of various asset classes.
Do defensive sectors protect in a bear market?
They mitigate, not protect. Consumer staples, utilities, and healthcare tend to fall less than the market, but they still fall. Switching to defensive stocks reduces the severity of the decline; reducing exposure or hedging reduces its effect on capital. These are two different orders of magnitude.
Should you stop your investment plan when the market drops?
Historical data suggests the opposite: contributions made during declines buy shares at lower prices and are often the ones that contribute the most to the final result. The greatest risk, during those phases, isn’t contributing—it’s selling what has already been accumulated.
Why are you publishing data that is unfavorable to your own model?
Because the number alone—”beats the market in 71% of months”—would only have half-described the reality. A figure that holds in one regime and reverses in another must be fully disclosed, otherwise the user will build expectations that won’t be met at the first downturn. We would rather you read that limit here than discover it in your own account.
The point
The question “which stock to buy” and the question “how much risk do I want to take” seem similar, but they are solved with completely different tools. Confusing them is the mistake that makes a portfolio fragile: increasingly refined signals accumulate for the first question, while the second remains unanswered until a downturn provides it.
The good news is that protection doesn’t require any foresight. It requires deciding in advance—with a clear head—how much of your capital you’re willing to see fluctuate, and building your portfolio around that decision.
This content is for informational purposes only and is intended for a general audience. It does not constitute financial advice, personalized recommendations, or investment solicitation. The data cited is derived from historical analysis; past performance is not indicative of future results. Each investment decision depends on the individual investor’s personal circumstances.