



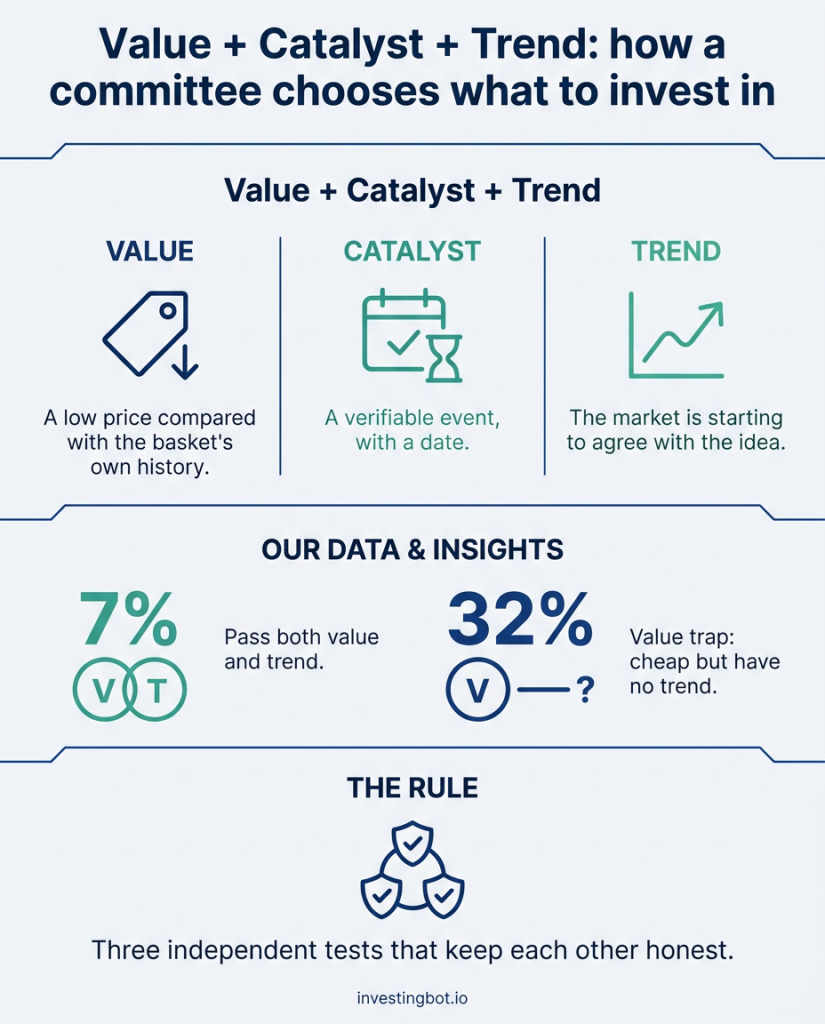
When an investment committee decides where to put money, it usually isn’t looking for a “good” stock. It is looking for an idea that passes three independent tests. Value asks whether the price is low for what you get; the catalyst asks why anything should change now; the trend asks whether the market is already starting to agree. Each test on its own is often wrong, and that is the whole point of the method: the three keep each other honest. In our data, only 7% of stock baskets pass both the value test and the trend test at the same time.
What the Value + Catalyst + Trend method is
It is an orderly way to answer three questions before committing money to an idea, whether that idea is a sector, an industry or a single company:
- Is it cheap? (value)
- What could change it, and when? (catalyst)
- Is the market noticing? (trend)
The point is not that all three are always required. The point is that each one covers the blind spot of the others. A cheap stock can stay cheap for years; a rising stock may already be expensive; an announced catalyst may never materialise. Asking the three answers to agree narrows the ideas down to a few — and that is what a committee is for: saying no, a lot.
Value: cheap compared with what?
The first question looks like the easiest one, but it hides a trap: cheap compared with what. A P/E of 12 is low for a software company and high for a bank. That is why the most useful comparison is not with the market but with the basket’s own history: a sector trading in the cheapest quarter of its last fifteen years is cheap relative to itself, whatever its absolute level.
What holds for any estimate holds here too: value is not a fact, it is a measurement with an error margin. The discount therefore has to be wide enough to cover that uncertainty, as we explained in our guide to the margin of safety.
Trend: does the market agree?
The trend does not tell you whether an idea is right. It tells you whether other investors are starting to see it the same way. It can be measured simply: are prices rising over the last few months, and is a good share of the companies in the basket trading above their long-term moving average (the 200-day average)? That second measure, breadth, matters: a basket that rises because two giants rise is not the same as a basket in which most companies are rising.
Above all, the trend does one job: it keeps you from buying too early. A sector can stay cheap and keep falling for a long time, and sectors tend to hand the baton to one another in cycles, as we describe in our article on sector rotation.
Catalyst: why now?
The catalyst is the event that can move the market from “not interested” to “convinced”: a change in monetary policy, a new investment cycle, a regulatory shift, a turnaround in margins, industry consolidation. It is the least numerical part of the method, and therefore the one most exposed to convenient stories.
Three rules make it useful rather than dangerous:
- It must be verifiable and dated. “The sector is undervalued” is not a catalyst; a decision expected on a specific date is.
- It must have a time horizon. If you don’t know by when it should work, you can’t even tell when it hasn’t.
- It must come with a counter-thesis. What happens if the event doesn’t arrive, or arrives and is already priced in?
In our own Committee, for example, catalysts are searched for only in recent, dated sources, and every idea carries its own counter-thesis.
What our data shows
We applied the two measurable tests — value and trend — to the 166 baskets into which our Committee divides 903 large US companies: sectors, industry groups, industries and sub-industries. The thresholds are deliberately simple:
- Value: the current P/E is in the cheapest quarter of its own history (15 years on average).
- Trend: the median 3-month return is positive and at least half of the companies trade above their 200-day average.
| Of the 153 baskets with history and trend available | Number | Share |
|---|---|---|
| Pass the value test | 60 | 39% |
| Pass the trend test | 35 | 23% |
| Pass both | 11 | 7% |
| Cheap but without a trend | 49 | 32% |
The most telling figure is the last one: for every cheap basket that also has a trend, there are more than four cheap baskets without one. At the level of the broad sectors the contrast is even sharper: five sectors out of eleven are cheap relative to their own history, and none of the five also has a trend.
We then followed the baskets week by week, for twelve consecutive weeks:
| Over 12 weeks | Value |
|---|---|
| “Cheap + trend” baskets still in that state the following week | 83% |
| “Cheap without trend” baskets that gain the trend the following week | 12% |
| Baskets that were “cheap + trend” at least once | 61 of 166 |
| Baskets that stayed “cheap + trend” for all 12 weeks | 5 |
When the combination is there, it tends to persist; when the trend is missing, it rarely shows up quickly. Waiting for the market to “notice” a discount can take a long time.
The value trap: a discount without a trend
A cheap basket that keeps falling can be an early opportunity — or a value trap: a low price that stays low, or goes lower, because the market is pricing in something that past multiples cannot see. This often happens when:
- Earnings are at the peak of the cycle and the P/E looks low just before they fall;
- The business is changing and its multiple history is no longer a fair comparison;
- The sector is under pressure for external reasons — interest rates, regulation, competition — that won’t resolve in a quarter.
The trend does not tell you which of the two cases is true. It does tell you that the market does not agree yet, and that alone is reason enough to treat the idea with more caution: in our Committee these baskets do not make it onto the list of ideas but onto a separate one, “awaiting confirmation”.
How to use it in practice
- Start from value relative to history, not from the absolute number: compare a sector or a company with itself before comparing it with the market.
- Ask the trend for permission. A discount without a trend belongs on a waiting list, not in the bin: if the trend arrives, the idea gets stronger.
- Write the catalyst down with a date. If you can’t put it in one verifiable sentence, it probably isn’t there.
- Write the counter-thesis down too. What would make you change your mind? Deciding beforehand stops you from changing the rules afterwards.
- Keep the idea small and diversified. Even an idea that passes all three tests can fail: the method improves the odds, it doesn’t give certainty.
What the research says, and what we don’t know yet
Value and trend are among the most studied phenomena in finance. Narasimhan Jegadeesh and Sheridan Titman, then at UCLA’s Anderson School of Management, showed in “Returns to Buying Winners and Selling Losers” (Journal of Finance, 1993) that, in the US market, the stocks that had risen most over the previous 3 to 12 months went on, on average, to do better in the following months. Clifford Asness (AQR Capital Management), Tobias Moskowitz (University of Chicago Booth School of Business) and Lasse Heje Pedersen (NYU Stern School of Business), in “Value and Momentum Everywhere” (Journal of Finance, 2013), found premiums for both value and momentum across many markets and asset classes — and, above all, that the two tend to move in opposite directions: combining them makes the result more stable than either one alone.
These are average results, over decades and thousands of stocks, with long stretches in which one or the other disappointed.
With our own data we need to be even more careful, and we’d rather say so with numbers. Over the twelve weeks we observed, the baskets that passed both tests had a median return of −2.4% over the following month, against +0.2% for the cheap baskets without a trend. That is the opposite of what the research suggests, but it covers eight overlapping windows in a single market period: it proves nothing, either way. That is exactly why the method is used to choose what to study, not to forecast next month. We will keep recording it so we can measure it over a longer period.
In short
- Value + Catalyst + Trend asks an idea to pass three independent tests: price, a reason to change, confirmation from the market.
- Value is measured better against the basket’s own history than against the market.
- The trend keeps you from buying too early: in our data, a cheap basket without a trend gains one the following week in only 12% of cases.
- The catalyst must be verifiable, dated and paired with a counter-thesis.
- Only 7% of baskets pass both value and trend: the method is mostly about saying no.
- Research supports combining value and momentum over the long run; our twelve weeks are too few to confirm or refute it.
What does Value + Catalyst + Trend mean?
It is a method for selecting investment ideas that requires three confirmations: that the price is low relative to value (value), that there is an event able to change the market’s mind (catalyst), and that prices are already starting to move in the right direction (trend).
Why isn’t it enough for a stock to be cheap?
Because a stock can stay cheap for years, or fall further, if the market is pricing in a real problem. In our data, for every cheap basket that also has a trend there are more than four cheap baskets without one.
What is a value trap?
A stock or a sector that looks cheap on multiples but is cheap for a good reason: earnings at the peak of the cycle, a declining business or lasting external pressure. The low price stays low, or falls further.
What counts as a catalyst?
A verifiable event, with a date or a time horizon, that can change how the market values an idea: a monetary policy decision, a regulatory change, a new investment cycle, a corporate transaction.
Isn’t trend just chasing what has already gone up?
On its own, it can be. Combined with value, it means something different: you don’t buy what has risen, you buy what is cheap and that the market is starting to agree on. Research suggests the combination is more stable than either strategy taken alone.
Can I apply the method to a single stock, or only to sectors?
To both. For sectors and industries the measures are more stable, because they average out many companies; for a single stock the catalyst and the financial statements weigh more, and the quality of the numbers needs closer attention.