



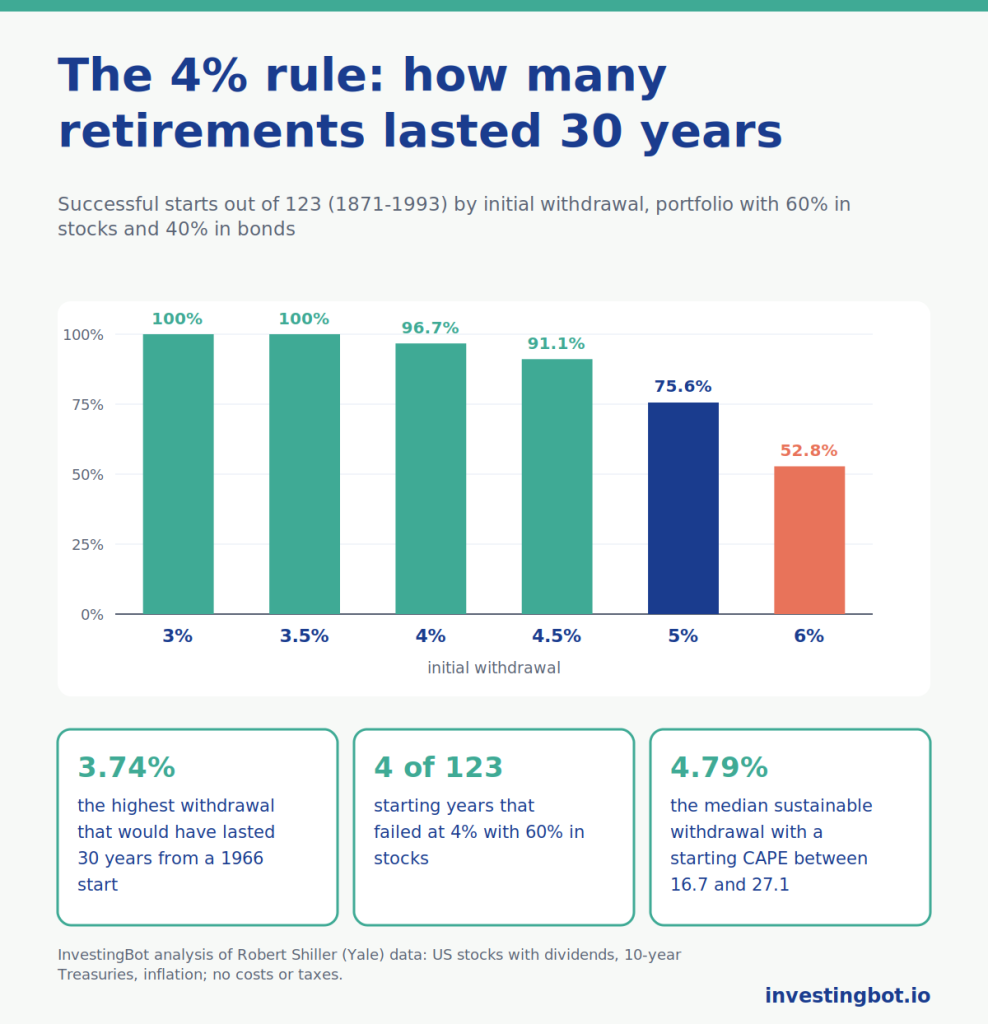
How much can you withdraw from your savings each year without running out? The best-known answer is the 4% rule: in the first year you withdraw 4% of the portfolio, then each year the same amount raised for inflation. In our calculations on US market data since 1871, with a portfolio of 60% stocks and 40% bonds, 4% lasted 30 years in 119 starting years out of 123, or 96.7%. But the sustainable rate depends heavily on when you start: when the market was expensive at the outset, it fell below 4%.
The 4% rule in a nutshell
The rule describes a withdrawal, not a return. It works like this:
- in the first year you withdraw 4% of the starting portfolio;
- from then on you withdraw the same amount, raised by that year’s inflation, whatever the markets have done;
- the goal is for the money to last at least 30 years.
With 500,000 euros you withdraw 20,000 euros in the first year; if prices rise 3%, the next year you withdraw 20,600. The portfolio stays invested and keeps rising and falling with the markets.
Where it comes from: Bengen and the Trinity study
William Bengen, an American financial planner, published “Determining Withdrawal Rates Using Historical Data” in 1994 (Journal of Financial Planning, October 1994). He ran the numbers for every starting year using US data from 1926 and found that, in the worst case, a retirement that began in 1966 lasted 30 years with an initial withdrawal of about 4.15%. Rounded down, that became the 4% rule.
Four years later Philip Cooley, Carl Hubbard and Daniel Walz, finance professors at Trinity University in San Antonio, published “Retirement Savings: Choosing a Withdrawal Rate That Is Sustainable” (AAII Journal, February 1998), later known as the Trinity study. They tested rates from 3% to 12%, periods from 15 to 30 years and portfolios from all stocks to all bonds. Two conclusions still hold: anyone who wants inflation-adjusted withdrawals must accept a much lower starting rate, and most retirees are better off keeping at least half of the portfolio in stocks.
Our calculations: 123 retirements of 30 years since 1871
We redid the test on the historical series of Robert Shiller (Yale), the same one behind our savings-plan tool: US stocks with dividends, 10-year Treasuries and inflation, month by month since 1871. The rules:
- one 30-year retirement starting every January from 1871 to 1993, that is 123 starting years;
- withdrawal at the start of each year, raised for inflation, and the portfolio rebalanced every January;
- no costs and no taxes; a retirement succeeds if the money does not run out before 30 years.
| Initial withdrawal | 100% stocks | 60% stocks | 40% stocks | 20% stocks |
|---|---|---|---|---|
| 3% | 100% | 100% | 100% | 100% |
| 3.5% | 100% | 100% | 100% | 96.7% |
| 4% | 97.6% | 96.7% | 94.3% | 77.2% |
| 4.5% | 91.9% | 91.1% | 77.2% | 53.7% |
| 5% | 80.5% | 75.6% | 60.2% | 45.5% |
| 6% | 69.9% | 52.8% | 39.0% | 30.9% |
With 60% in stocks, 4% fails in 4 starting years out of 123: 1965, 1966, 1968 and 1969. The highest withdrawal that would have lasted 30 years ranges from 3.74% for a 1966 start to 11.02% for a 1982 start, with a median of 6.26%. With all stocks the worst case is a 1929 start, at 3.78%. The result is close to Bengen’s: the worst year is the same, the level slightly lower because we use the 10-year Treasury and data going back to 1871.
Why some starts fail: the sequence of returns
Those who retired in the mid-sixties met a stock market that went nowhere for years and then the high inflation of the seventies. Withdrawals, raised with prices, kept growing just as the portfolio was shrinking. This is sequence risk: for the same average return, losses in the first years do far more damage than late ones, because they hit a portfolio that is already being drawn down. With a 5% withdrawal and 60% in stocks, in the worst cases the money ran out after just 19 years.
The other side is less well known. At 4% with 60% in stocks, the portfolio left after 30 years was a median 1.32 times the starting amount, after inflation, and in 61.8% of starting years it ended with more purchasing power than at the start. A rule built on the worst case, most of the time, leaves a lot of money unspent.
How much the starting valuation matters
Shiller’s CAPE measures how expensive the market is: the price divided by the average earnings of the last ten years, after inflation. We split into three groups the 113 starting years for which the CAPE is available:
- CAPE between 5.1 and 12: median sustainable withdrawal 7.49%, minimum 5.07%;
- CAPE between 12 and 16.7: median 5.78%, minimum 4.53%;
- CAPE between 16.7 and 27.1: median 4.79%, minimum 3.74%. Here 4% succeeded in 89.7% of starting years and 4.5% in 71.8%.
Every failure at 4% comes from the most expensive group. In October 2026, the latest figure published by Shiller, the CAPE was 40.7: higher than any starting value in our sample and close to the December 1999 record (44.2). The starting years with the most expensive market in history, such as 1999 and 2000, have not completed their 30 years yet. This is not a forecast: it is a limit of the data, and a good reason not to take 4% for granted.
Costs, countries and taxes: three caveats
- Costs: with costs of 0.5% a year on the 60% stock portfolio, 4% succeeds in 94.3% of starting years and 4.5% in 79.7%, against 96.7% and 91.1% without costs.
- Countries: Wade Pfau, then at the National Graduate Institute for Policy Studies in Tokyo, in “An International Perspective on Safe Withdrawal Rates” (Journal of Financial Planning, December 2010) redid the calculations for 17 developed countries and 109 years of data: a 4% real withdrawal would have been safe in only 4 countries out of 17. The United States was one of the best markets of the century, so its data may be optimistic.
- Taxes: our calculations are before tax. Taxes on returns and withdrawals depend on the country you live in and the instruments you use, and can noticeably reduce the net withdrawal.
And the time horizon matters: 30 years is the classic assumption. Anyone who stops working early and needs to cover 40 or 50 years needs a lower starting rate.
Fixed or flexible withdrawals
The 4% rule keeps the withdrawal fixed and ignores the markets. Those who accept a variable income can withdraw more at the start. Jonathan Guyton and William Klinger, in “Decision Rules and Maximum Initial Withdrawal Rates” (Journal of Financial Planning, March 2006), proposed rules that cut the withdrawal by 10% when the current rate rises too far above the initial one and raise it by 10% in the opposite case. In their test, with at least 65% in stocks, initial withdrawals between 5.2% and 5.6% were sustainable. The price is an income that changes from one year to the next.
The simplest form of flexibility is to withdraw each year a fixed percentage of the portfolio at that moment: the money never runs out, but the income follows the markets. Between the two lies a whole range of band-based rules. Either way, it pays to keep the split between stocks and bonds in place, as we explain in our guide to portfolio rebalancing.
Where to find these tools on InvestingBot
Our savings-plan tool (Semaforo PAC) uses the same historical series as this article and shows the S&P 500 CAPE with its position in history: in our calculations, it is the figure that moves the sustainable withdrawal the most. Portfolio Structure helps you set the split between stocks and bonds. To see how the probability of success changes across thousands of scenarios rather than past years, read our guide to Monte Carlo simulation.
In short
- The 4% rule withdraws 4% of the portfolio in the first year and then the same amount raised for inflation.
- On US data since 1871, with 60% in stocks, 4% lasted 30 years in 119 starting years out of 123.
- The highest sustainable withdrawal ranged from 3.74% (a 1966 start) to 11.02% (1982), with a median of 6.26%.
- The starting valuation matters a lot: with the CAPE between 16.7 and 27.1 the median sustainable withdrawal was 4.79%, against 7.49% with the CAPE below 12.
- Costs, taxes, longer horizons and markets other than the US push the prudent rate below 4%.
What is the 4% rule?
It is a withdrawal rule: in the first year you withdraw 4% of the portfolio, then each year the same amount raised for inflation, with the goal of making the money last at least 30 years. It comes from William Bengen’s 1994 study.
Does the 4% rule always work?
No. In our calculations on US data since 1871, with 60% in stocks, 4% failed in 4 starting years out of 123: 1965, 1966, 1968 and 1969. In the worst case, a 1966 start, the highest sustainable withdrawal was 3.74%.
In retirement, is it better to hold more stocks or more bonds?
In our tests at 4%, the portfolio with 60% in stocks succeeded in 96.7% of starting years, the one with 20% in stocks in 77.2%. With few stocks the portfolio grew too little to support inflation-adjusted withdrawals.
Does the 4% rule work outside the United States?
Less well. Wade Pfau’s 2010 study of 17 developed countries and 109 years of data found that a 4% real withdrawal would have been safe in only 4 countries out of 17. US data come from one of the best markets of the century.
How much does the moment you start withdrawing matter?
A lot. With a starting CAPE below 12 the median sustainable withdrawal was 7.49%; with the CAPE between 16.7 and 27.1 it fell to 4.79%, and every failure at 4% comes from that group.
How much do costs affect the sustainable withdrawal?
With costs of 0.5% a year on the portfolio with 60% in stocks, success at 4% falls from 96.7% to 94.3% and at 4.5% from 91.1% to 79.7%. Before deciding how much to withdraw, it pays to know how much the portfolio costs.