



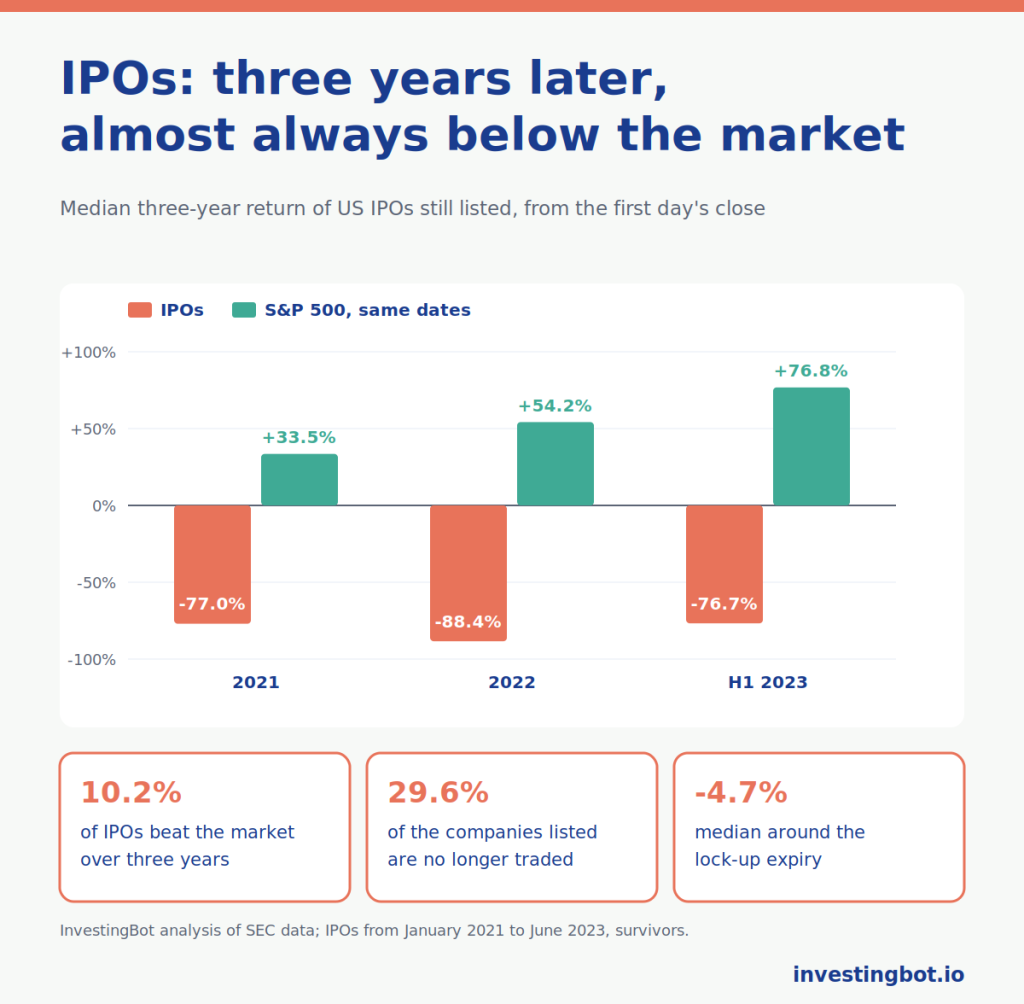
An IPO is the moment a company sells its shares on the stock market for the first time. It makes headlines and invites you to buy right away. Yet one of the most studied facts in finance says that, on average, newly listed companies return less than the market in the years that follow. On our data, the US IPOs from 2021 to 2023 that are still listed today lost a median of 77.7% over three years, while the market rose 34.6%.
What an IPO is, in a nutshell
IPO stands for initial public offering: a company that was private until then sells shares to the public and starts trading on an exchange. There are three main routes:
- the traditional listing, with banks collecting orders and setting an offer price;
- the merger with a SPAC, an already listed company created only to buy another one;
- the spin-off, when a group lists one of its parts as a separate company.
The offer price usually goes only to institutional investors. Anyone buying on the exchange pays the first trading day’s price, which is often already different, and that is where our numbers start.
What the research says
The reference study is by Jay Ritter, published in 1991 in the Journal of Finance: across 1,526 US IPOs from 1975 to 1984, bought at the first day’s close and held for three years, returns were markedly lower than those of similar listed companies. Ritter also found that companies listed in years of great enthusiasm, when IPOs are plentiful, fared worse.
In 1995 Tim Loughran and Jay Ritter widened the sample to 4,753 IPOs from 1970 to 1990, in the study titled “The New Issues Puzzle”: in the five years after listing, IPOs returned about 5% a year on average, and matching the wealth of someone who had bought similar companies that had not recently listed would have required investing 44% more money.
Not everyone reads it the same way. Alon Brav and Paul Gompers showed in 1997 that the gap shrinks a lot when IPOs are compared with companies of the same size and the same price-to-book ratio, and that IPOs backed by venture capital funds did not perform significantly worse. The effect is concentrated in small companies.
Our data: US IPOs from 2021 to 2023
We took from the SEC, the US securities regulator, every company that filed a final IPO prospectus between January 2021 and June 2023, excluding companies that were already publishing periodic reports (and were therefore already listed), SPACs and funds. The result is 625 IPOs. For each one we measured the return of buying at the close of the first trading day, with dividends reinvested, and compared it with the S&P 500 over the same dates.
| Year of listing | IPOs measured | Median three-year return | S&P 500 over the same dates | Share that beat the market |
|---|---|---|---|---|
| 2021 | 238 | -77.0% | +33.5% | 8.8% |
| 2022 | 61 | -88.4% | +54.2% | 11.5% |
| First half of 2023 | 43 | -76.7% | +76.8% | 16.3% |
| Total | 342 | -77.7% | +34.6% | 10.2% |
The median return is that of the company in the middle of the ranking: half did better, half did worse. Every IPO carries the same weight, small or large.
Of the 625 stocks listed in that period, 185 no longer trade on an exchange today: 29.6%. Some were bought by other companies, others went bankrupt or left the market. We do not have prices for them, so the figures above cover only the survivors.
It is an important limit, and it points the opposite way to what you might expect: companies that left the market because of trouble almost always lost more than those that stayed. The true picture, with all of them included, is therefore worse than the one in the table.
Three years later: the survivors
Among the 342 survivors we could measure:
- after one year the median stood at -62.4%, against -2.1% for the S&P 500, and only 12.3% had beaten the market;
- after three years 86.0% were at a loss and only 10.2% had done better than the market;
- 6.1% had more than doubled: the big exceptions exist, but they are few and hard to spot on day one.
2021 was a year of euphoria, with a record number of listings and very high valuations, and our sample carries its weight. It is exactly the case Ritter described: IPOs from crowded years are the ones that do worst.
The lock-up: what happens after six months
When a company lists, founders, employees and early investors commit not to sell for a period, usually 180 days: this is the lock-up. When it ends, they can sell. Field and Hanka, in a 2001 study of 1,948 lock-ups, measured at expiry an average drop of 1.5% over three days and a lasting 40% rise in trading volume, stronger when the company was backed by venture capital.
On our data, between the 170th and the 190th trading session after listing, when the lock-up usually expires, the IPO median is at -4.7% against +1.6% for the market, and 61.7% fell. It is one of the reasons many people wait for that date before deciding.
Why it happens
- Companies choose the moment: they list when the market pays well for their story, that is, when prices are high.
- Early optimism: those who buy in the first days often pay for the best growth expectations, and the reality of the accounts comes later. We discussed this temptation in the article on the biases that cost you money.
- Little data: pre-listing accounts are in the prospectus, but there is not yet a track record of public quarterly reports to check the promises against.
- More shares on the way: with the lock-up and later capital increases, the supply of shares grows precisely in the following months.
It is not a law: it is an average, with big exceptions. But it is the reason many investors wait for the lock-up to expire and for a few quarterly reports before deciding.
The right questions before buying an IPO
- Have I read the prospectus? Revenue growth, margins, how much cash it burns, what the money raised is for and who is selling shares.
- What is it worth compared with similar listed companies? A much higher valuation needs much higher growth to justify it.
- When does the lock-up expire? Buying just before means accepting the pressure of those who can finally sell.
- How many quarterly reports has it published? The first two or three show whether the prospectus figures hold up. To see whether a company really generates cash, look at its free cash flow.
- Am I buying the company or the news? The noise of the first day says nothing about the next three years.
Where to find new listings on InvestingBot
New US listings join our list even if they are not yet part of an index, as long as they have traded for at least 10 sessions with sufficient volume. On the stock page you see price, volume and trend right away; financial data appear when the company publishes its first accounts in a format we can verify, usually after the first quarterly report for US companies and after the first annual report for foreign ones. Until then, we do not replace them with estimates.
In short
- On average, IPOs have returned less than the market in the years after listing: Ritter showed it in 1991 and Loughran and Ritter in 1995.
- For US IPOs from 2021 to 2023 still listed, the three-year median is -77.7% against +34.6% for the S&P 500.
- Only 10.2% beat the market, and 29.6% of the companies listed in that period are no longer on the exchange.
- Around the lock-up expiry the median fell by 4.7%.
- The effect is stronger in years of euphoria and in small companies, and it has big exceptions.
- Waiting for the lock-up and a few quarterly reports guarantees nothing, but lets you decide on real numbers.
What is an IPO?
It is the initial public offering: the moment a company sells its shares to the public for the first time and starts trading on an exchange.
Is it worth buying shares at the IPO?
On average, no: the research of Ritter and of Loughran and Ritter shows that IPOs returned less than the market in the following years. On our data, US IPOs from 2021 to 2023 still listed lost a median of 77.7% over three years. There are exceptions, but they are few.
What is an IPO lock-up?
It is the commitment of founders, employees and early investors not to sell their shares for a period after listing, usually 180 days. When it ends they can sell, and the stock tends to come under pressure.
Why do IPOs underperform the market?
Companies tend to list when prices are high, early buyers pay for optimistic expectations, there are no quarterly reports yet to check the promises against, and after the lock-up new shares reach the market.
Do all IPOs do badly?
No. The result is an average: on our data 6.1% of surviving IPOs more than doubled in three years. The problem is recognising them in advance, when data are still scarce.
How long should you wait before buying a newly listed company?
There is no rule that fits everyone. Many investors wait at least for the lock-up to expire, usually six months, and for two or three quarterly reports, so they decide on published accounts and not only on the prospectus.