



Most avoidable losses don’t come from bad analysis. They come from a decision made at the wrong moment for the wrong reason: selling what’s rising to “lock in the gain”, holding what’s falling “until it gets back to even”, buying whatever has just doubled. These are systematic errors, studied for decades, and they happen to people who understand the numbers perfectly well. This guide covers the six that cost the most, what the data actually shows, and why a method written down in advance beats any amount of good intentions.
Why biases cost more than bad analysis
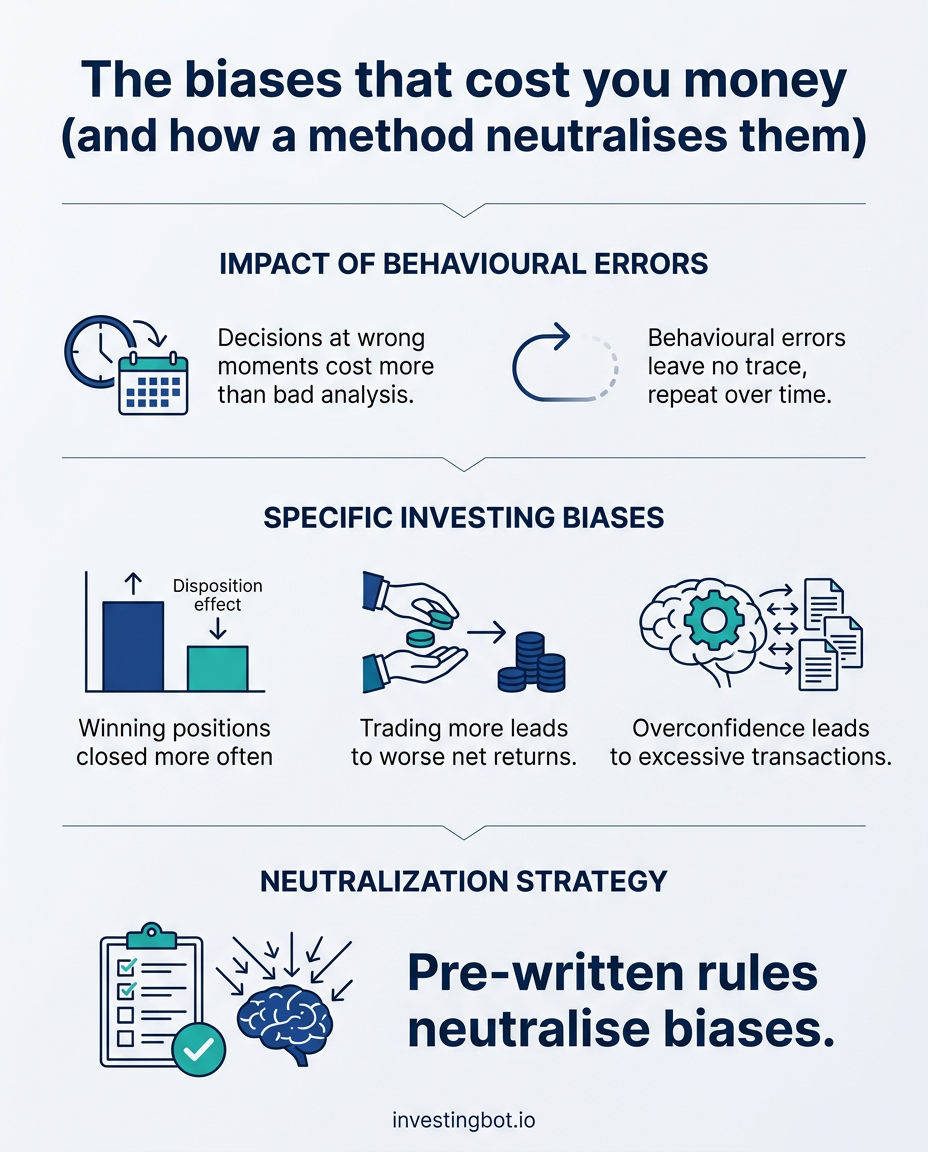
An analytical error is visible. A figure is wrong, something doesn’t add up, sooner or later someone notices. A behavioural error leaves no trace. It produces nothing unusual — it produces a decision that looks reasonable at the time, and only turns out expensive months later, when nobody connects it back to the cause.
Worse, these errors repeat. Someone who sells a rising position too early tends to do it again, because the relief of banking a profit is an immediate reward, while the cost — the rally continuing without them — arrives later and in abstract form. That’s why recognising a bias isn’t enough to avoid it. You have to remove the opportunity for it.
Six errors that keep repeating
1. Selling the winners and keeping the losers
This is the best documented of them all. Shefrin and Statman (1985) named it the disposition effect, and Odean (1998) measured it on the real accounts of thousands of investors: winning positions get closed far more often than losing ones, with everything else held equal.
The underlying logic is the one described by Kahneman and Tversky (1979) in prospect theory: a loss weighs more emotionally than a gain of the same size. As long as you don’t sell, the loss stays “on paper” and never has to be booked in your head. Selling means admitting it.
The practical result is a portfolio that selects itself backwards: the worst positions stay, the best ones leave. Anyone who only looks at what they currently own will never notice, because the winners they sold are no longer there to compare against.
2. Believing you can pick better than average
Barber and Odean (2000) compared trading activity and net returns across tens of thousands of accounts: those who trade more end up with worse results, and the gap is not marginal. Not because they choose badly, but because every transaction has a cost, and confidence in your own timing leads to far more transactions than the strategy needs.
Overconfidence has a recognisable signature: you become convinced you know when, not just what. It’s the difference between “this company looks solid to me” and “this company will rise over the next three months”. The first statement can be checked; the second requires you to guess what everyone else will do.
3. Anchoring to a number
The price you paid means nothing to the market. It’s a fact about your history, not about the company. Yet it becomes the reference point for every decision that follows — “I’ll wait until it gets back to what I paid” — as though the stock knew what your entry was.
The same applies to published price targets. They’re precise numbers, and precision reads as authority. But a single figure hides how wide the uncertainty behind it really is. That’s why, when we compute a fair value, we show a range with a stated uncertainty level rather than one exact price. A wide range is honest information; a precise number on an unpredictable company is fiction.
4. Chasing whatever just went up
Recent performance is the most visible information available and the least useful. A ranking of last period’s returns draws attention precisely because it’s ordered, simple, and appears to say something about the future. What it actually says is what has already happened — and that is often what makes a stock or a sector more expensive, not more promising.
It is the same wall you hit trying to guess the lows, which we covered in why predicting the bottom is nearly impossible.
This bias carries a double cost: you enter late into something that has already run, and you exit when it stops running. In other words, you buy high and sell at a discount, in perfect mirror image of what you were trying to do.
5. Looking only for confirmation
Once you hold a position, the way you read the news changes. Favourable information feels relevant; unfavourable information feels like noise or pessimism. This isn’t dishonesty — it’s how attention normally works once a decision has been made.
The remedy isn’t “being objective”, which nobody can do on demand. It’s writing down in advance what would change your mind: which figure, which event, which threshold. A thesis that doesn’t say how it could be proven wrong isn’t a thesis. It’s a preference.
6. Remembering the wins and filing away the losses
Ask anyone who has been investing for a few years how it went, and you’ll get the story of two or three trades: the ones that worked. It isn’t dishonesty, it’s selective memory — the same effect that makes coincidences feel more frequent than they are. Without a written record of decisions at the moment they were made, the only assessment available is a recollection, and recollection has already done the filtering.
Three uncomfortable numbers from our own data
We measured three things across our stock universe, because these are the points where intuition goes wrong most often.
1. Analyst consensus is almost always optimistic. Looking at the published price targets for the stocks we cover, roughly nine US stocks in ten and more than eight European stocks in ten carry a target above the current price, with a median implied upside somewhere around 16–20%. If that were a reliable forecast, the entire market would have to rise by that much. It’s useful information about what consensus thinks — not an estimate of what you’ll earn. Using it as an anchor is one of the most direct ways to overpay.
2. The average describes almost nobody. Over the most recent year of trading, the average European stock return is comfortably positive, while the median — the stock sitting exactly in the middle — is close to zero. The reason is that the top 10% of stocks alone average vastly more than everything else: strip out that tenth, and the average return of the rest turns negative. In the US the pattern is identical, just with more generous signs.
This isn’t a quirk of the period. It’s the structure of equity returns. Bessembinder (2018) documented it across decades of history: stock market wealth creation concentrates in a minority of shares, while the majority fails to beat even a risk-free alternative. The practical consequence is counterintuitive — a concentrated portfolio is far more likely to miss the handful of stocks that matter than to find them.
3. “Just pick well” describes reality poorly. Over the same period, almost half of European stocks and roughly a third of US stocks finished in the red, and a quarter of the European ones lost more than 20%. An investor picking ten European stocks at random would hold, on average, four or five losing positions — and would remember them as bad luck rather than as statistics.
The bias we had to correct in ourselves
For a long time we displayed a single score that summarised every company in one number from 1 to 10, built by averaging four groups of indicators: fundamentals, technicals, analyst estimates and risk.
We removed it, and the reason is precisely a bias. Measuring the relationship between those groups, we found that company quality and market behaviour are close to independent of each other: averaging them into a single number wasn’t producing a summary, it was cancelling out two different pieces of information. On more than a third of stocks the two sides diverged sharply, and the final score hid exactly the interesting fact — that the business was solid while the market was punishing it, or the reverse.
The single number was convenient, sortable and reassuring: it satisfied the appetite for a simple answer. In its place, the company page now shows the separate, checkable facts, each with its threshold stated. It’s less immediate, and that’s the point: the convenience of a composite score was its most dangerous feature.
What a method does that good intentions don’t
A bias can’t be beaten with attention, because attention is exactly the resource that’s missing at the moment of decision. It’s beaten by removing the opportunity — deciding beforehand what would be hard to decide afterwards.
- Write the thesis and its disproof. Before buying: why I’m doing this, and what would have to happen for me to change my mind. Two lines, with a date.
- Decide the position size before the stock. If any single holding can be at most a set share of the portfolio, the question “how much do I buy” stops depending on the enthusiasm of the moment.
- Rebalance to a rule, not to a feeling. Bringing weights back to their chosen levels mechanically forces you to trim what has risen and add to what has fallen — the exact opposite of the disposition effect.
- Automate the contributions. A regular savings plan makes the question “is this the right moment?” irrelevant, and that question consumes more time and more money than any other.
- Diversify for real. Not twenty positions that move together, but exposures that respond to different drivers. It’s worth checking concentration inside an index too: in the US market the ten largest stocks alone account for over a third of total market capitalisation, and the top three sectors cover around two thirds of the largest companies. An index fund is less spread out than its number of holdings suggests.
- Keep a record. Every decision with its date and its reason. It’s the only antidote to selective memory, and after a year it becomes the most useful tool you own.
None of these rules requires predicting anything. They only require having decided in advance — the one moment when you can think without the weight of an open position.
A special case: home bias
French and Poterba (1991) documented that investors hold a share of their portfolio in their own domestic market far above that market’s weight in the world. Familiarity gets mistaken for information: you know the brands, you read the news in your own language, those companies feel more understandable.
The cost isn’t theoretical. It means tying your savings to the same economic cycle your income already depends on. This is the case where two risks that look separate turn out to be the same risk.
In short
- Biases cost more than analytical errors because they produce nothing visible — only decisions that seem sensible at the time.
- The disposition effect (selling winners, keeping losers) selects your portfolio backwards, and looking only at what you hold hides it.
- Trading more does not improve results: overconfidence shows up as a shift from “what” to “when”.
- A precise number — your entry price, a price target — is an anchor, not information. A range with stated uncertainty is more honest.
- In our data, nine US stocks in ten carry an analyst target above the price: that’s consensus sentiment, not a forecast.
- The median return is far below the average: a few stocks produce almost all of the result, and a concentrated portfolio has a good chance of not holding them.
- A method works because it moves the decision earlier: written thesis with its disproof, maximum weights, rule-based rebalancing, automatic contributions, a decision log.
Frequently asked questions
Is knowing about a bias enough to avoid it?
No, and that’s the most robust finding in this literature: these errors show up even in the people who study and teach them. They act at the moment of decision, when attention is occupied elsewhere. The only defence that works is procedural — set the rules in advance, so that at the critical moment there’s no choice left to make.
Why is it wrong to wait for a stock to return to what I paid?
Because that price doesn’t exist for anyone but you. The right question isn’t “what did I pay”, it’s “if I didn’t already own this, would I buy it today at this price?”. If the answer is no, holding it is a purchase decision you wouldn’t make — dressed up as waiting.
If analysts nearly always publish a target above the price, is that data useless?
It isn’t useless, it’s misread. It tells you what consensus expects and, more importantly, how that expectation changes over time: a downward revision on a stock is information. The absolute level, by contrast, should be read knowing it’s almost always positive — so it doesn’t distinguish one stock from another.
How many positions does it take to be genuinely diversified?
There’s no single right number, and the count matters less than people think: twenty stocks in the same sector behave almost like one. It’s more useful to look at what the results depend on — sectors, regions, currencies, company size — and check that they don’t all depend on the same thing.
Does a regular savings plan protect against biases, or is it just a way to start?
It does both, but the first is the main value: by automating the amount and the schedule, it removes the recurring decision that biases grip hardest, namely “is this the right moment?”. It doesn’t guarantee a better outcome than investing a lump sum, but it makes a behavioural mistake far less likely.
We ran the numbers on that comparison across a century and a half of market history: should you invest it all at once?
How do I tell whether I’m chasing recent performance?
A practical test: try writing your reason for buying without referring to past performance. If a thesis survives — the company earns more, the sector has a structural advantage, the price is low relative to earnings — then you aren’t chasing. If nothing is left once you remove “it’s gone up a lot”, the answer is yes.