



Free cash flow is the cash a company generates from its business after paying for the investment needed to maintain and grow it. It is harder to inflate than earnings, because it counts money that actually came in and went out, not accounting estimates. But it can mislead too: in our data, for 95 US companies stock-based pay exceeds the whole free cash flow of the latest fiscal year.
What free cash flow is, in a nutshell
It takes two steps:
- operating cash flow: the cash produced by the business, meaning receipts from customers minus payments to suppliers, employees and the tax authorities;
- minus capital expenditure on plants, machinery, buildings and technology, what financial statements call capex.
What is left is “free” cash: the company can use it to pay dividends, buy back shares, reduce debt or keep it, without asking anyone for money. An example: in the fiscal year ended June 2026 Microsoft produced $182.9 billion of operating cash flow and invested $116.0 billion, for free cash flow of $67.0 billion against net income of $133.8 billion.
Why it is harder to fake than earnings
Net income follows accrual accounting: revenue is booked when it is earned, even if the customer has not paid yet, and costs are spread over the years through depreciation, provisions and write-downs. The rules make sense, but they leave room for estimates and choices. Cash flow, instead, records money when it changes hands.
The gap between earnings and cash is called accruals, and it matters. Richard Sloan, then at the University of Pennsylvania (Wharton), showed in “Do Stock Prices Fully Reflect Information in Accruals and Cash Flows about Future Earnings?” (The Accounting Review, 1996) that the part of earnings backed by cash tends to persist more than the part made of accounting entries, and that the market did not fully price this: companies with earnings far above their cash went on to deliver lower returns.
The term has another history as well. Michael Jensen, of Harvard Business School, in “Agency Costs of Free Cash Flow, Corporate Finance, and Takeovers” (American Economic Review, 1986) used free cash flow to mean the cash in excess of profitable investment opportunities, and argued that this is exactly where the risk lies that managers waste it instead of returning it to shareholders.
Our data: 1,885 US companies
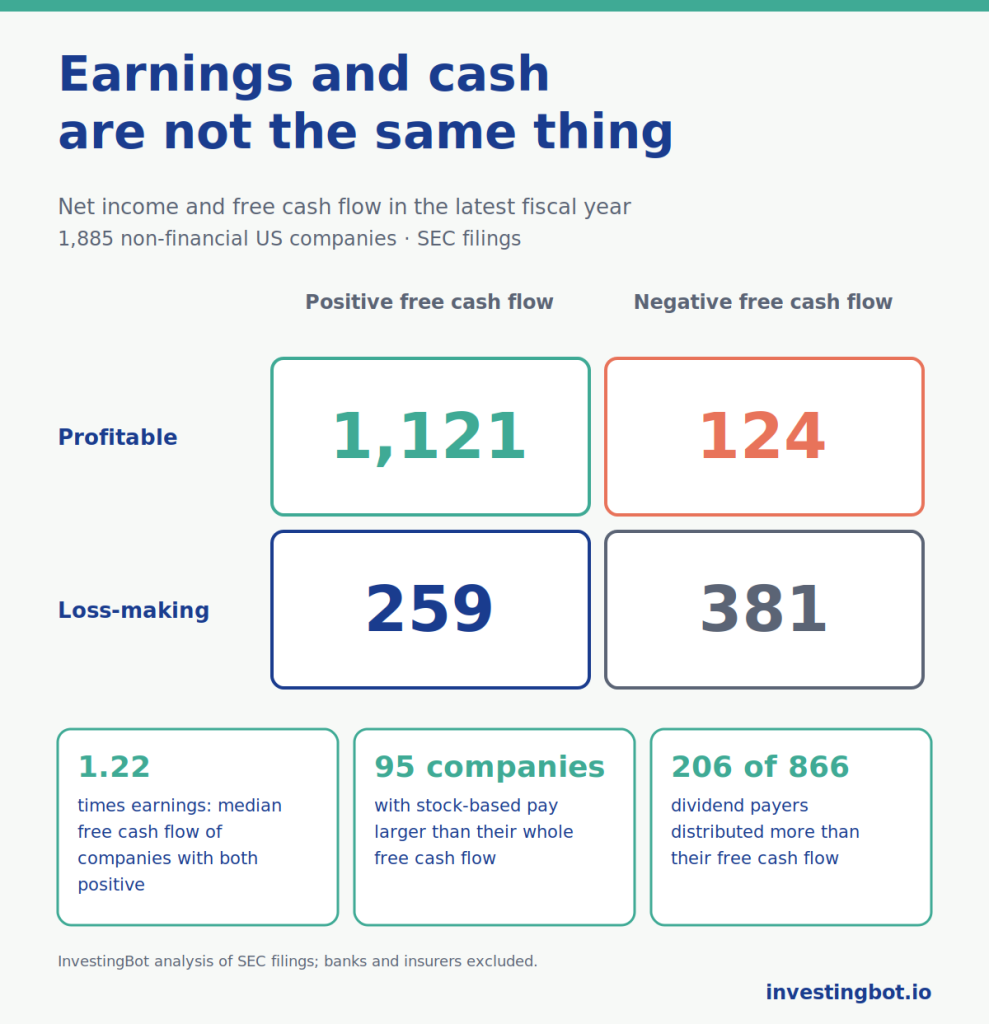
We compared net income and free cash flow for the latest completed fiscal year, from filings with the SEC, for 1,885 US companies on the platform. We left out banks and insurers, for which free cash flow does not measure the cash generated.
| Positive free cash flow | Negative free cash flow | |
|---|---|---|
| Profitable | 1,121 | 124 |
| Loss-making | 259 | 381 |
In most cases earnings and cash point the same way. But 124 of 1,245 profitable companies (about one in ten) burned cash, and 259 of 640 loss-making ones generated it. Among companies with both earnings and free cash flow positive, free cash flow was a median 1.22 times earnings; adding up the last five fiscal years the ratio falls to 1.08. Only 8.7% turned less than half of their earnings into cash.
When earnings do not become cash
Negative free cash flow alongside positive earnings is not necessarily a bad sign. It often means the company is investing far more than it depreciates. In the fiscal year ended May 2026 Oracle reported $17.1 billion of net income and $32.0 billion of operating cash flow, but invested $55.7 billion: free cash flow of -$23.7 billion. Profitable companies with negative cash flow also include many utilities, such as Duke Energy and Southern Company, which build grids and power plants for years before reaping the returns.
The right question is not “is it negative?”, but “why, and for how long?”. Investment rising with operating cash flow tells a different story from operating cash flow thinning out while earnings stay high.
When free cash flow misleads
Harder to fake does not mean impossible. Three cases to keep in mind:
- Stock-based pay. Shares given to employees and executives are a real cost, but they do not leave the cash account, so free cash flow does not subtract them. In our data they are a median 13.4% of free cash flow, 28.2% in the technology sector. In 221 companies they exceed half of free cash flow and in 95 they exceed all of it: in 2025 Amazon reported $19.5 billion of stock-based pay and $7.7 billion of free cash flow.
- Lumpy investment. A single year’s free cash flow can collapse or swell just because investment is concentrated in that period. Amazon went from $32.9 billion of free cash flow in 2024 to $7.7 billion in 2025, with capex rising from $83.0 billion to $131.8 billion. That is why it pays to look at several years together.
- Working capital. Paying suppliers later, or selling customer receivables before they fall due, lifts one year’s operating cash flow without the business having improved. It cannot be repeated forever: sooner or later suppliers must be paid.
Dividends and free cash flow
A sustainable dividend is paid out of cash, not earnings. Among the 866 companies that paid a dividend in the latest fiscal year, 206 (almost one in four) distributed more than their free cash flow: the difference came from accumulated cash or new debt. It can happen for a year; if it keeps happening, the dividend is at risk. It is one of the signals we also describe in the article on corporate fragility.
How to read free cash flow: the right questions
- How much of earnings becomes cash? The ratio of free cash flow to net income, looked at over several years, tells you how solid the earnings are.
- How much does stock-based pay weigh? If it is a large part of free cash flow, the “free” cash is really being paid for by shareholders through dilution.
- Is investment exceptional or structural? One year of heavy investment is not a problem; a company that must always invest more than its operating cash flow is.
- Do dividends and buybacks fit within free cash flow? If they exceed it, someone is paying the difference.
- Does the sector make it meaningful? For banks and insurers free cash flow does not mean the same thing, and other indicators are needed. We cover them in reading a balance sheet in 6 numbers.
Where to find these numbers on InvestingBot
On each stock’s page you will find free cash flow to net income, with an attention threshold below 50%, stock-based pay as a share of revenue, the years needed to repay debt out of free cash flow and the ratio of dividends to free cash flow. The multiples-over-time section shows the free cash flow margin and the EV/FCF multiple year by year, so you can see whether a weak year is an exception or a trend.
In short
- Free cash flow is operating cash flow minus capital expenditure: the cash the company really keeps.
- It is harder to inflate than earnings because it counts money when it changes hands, not accounting estimates.
- Among 1,885 non-financial US companies, one in ten profitable ones burned cash in the latest fiscal year.
- Median free cash flow was 1.22 times earnings, 1.08 over five years.
- Stock-based pay inflates it: in 95 companies it exceeds the whole free cash flow.
- Almost one in four dividend payers distributed more than its free cash flow.
What is free cash flow?
It is the cash a company generates from its business after paying for investment in plants, machinery and technology. It is calculated as operating cash flow minus capital expenditure, and shows how much is left for dividends, share buybacks or debt reduction.
What is the difference between free cash flow and net income?
Net income follows accrual accounting and includes estimates such as depreciation and provisions; free cash flow counts money that actually came in and went out. In our data, one in ten profitable companies had negative free cash flow in the latest fiscal year.
Is negative free cash flow a bad sign?
Not always. It often signals a phase of heavy investment, as with Oracle in the fiscal year ended May 2026 or many utilities. It becomes a problem when operating cash flow shrinks and the company has to borrow year after year.
Can free cash flow be manipulated?
Less than earnings, but yes. Stock-based pay is not subtracted, payments to suppliers can be delayed and investment can be bunched into a few years. That is why it pays to look at several fiscal years together and at the weight of stock-based pay.
What is stock-based pay and why does it matter?
It is shares given to employees and executives as part of their pay. It is a real cost that dilutes shareholders, but it does not leave the cash account. In our data it is a median 13.4% of free cash flow and 28.2% at technology companies.
How can you tell whether a dividend is covered by free cash flow?
Compare dividends paid with free cash flow for the same year, ideally over several years. Of the 866 US companies that pay a dividend, 206 distributed more than their free cash flow in the latest fiscal year.