



Beta measures how much a stock tends to move with the market: a beta of 1 means it follows the index on average, a beta of 1.5 that it amplifies the index’s moves by 50%, a beta of 0.5 that it halves them. Drawdown, on the other hand, measures how far an investment has fallen from its last peak. They are two different things, and mixing them up is expensive: in our data, among US stocks with a beta below 0.8, the so-called “defensive” ones, 342 out of 894 lost more than 30% over the last twelve months.
What beta is, in a nutshell
Beta comes from the model that links risk and expected return, the Capital Asset Pricing Model, put forward by William Sharpe, then at the University of Washington and later winner of the 1990 Nobel Prize in Economics, in “Capital Asset Prices: A Theory of Market Equilibrium under Conditions of Risk” (Journal of Finance, 1964). The idea: part of a stock’s risk comes from the market as a whole, and beta measures how strongly the stock responds to it.
In practice, the stock’s returns are compared with the index’s returns over the same period:
- beta of 1: on average the stock moves like the market;
- beta above 1: it amplifies market moves, in both directions;
- beta below 1: it dampens them;
- beta close to zero or negative: the stock goes its own way, or the opposite way.
On the InvestingBot company page, beta is calculated on 5 years of monthly returns against the S&P 500. As of 8 October 2026, Coca-Cola had a beta of 0.34, Apple 1.08 and Nvidia 2.22.
What drawdown is, and why it hurts more than it looks
Drawdown is the loss measured from the last peak. The maximum drawdown over a period is the deepest fall from a peak to the lowest point that follows: it answers the question “how much could I have lost at the worst moment?”.
It hurts more than it looks because losses are not recovered symmetrically. After a 20% fall you need a 25% gain to get back to where you started; after a 30% fall you need 42.9%; after a 50% fall you need 100%. The deeper the fall, the longer the road back to breakeven.
What beta tells you, and what it doesn’t
Beta only measures market-related risk, and it measures it on average. It says nothing about a company’s own problems: a disappointing quarter, an investigation, a product that doesn’t sell, a debt that needs refinancing. Those blows can sink a stock even while the market rises, and beta doesn’t see them.
There is also a long-known limit. Eugene Fama and Kenneth French, both at the University of Chicago, showed in “The Cross-Section of Expected Stock Returns” (Journal of Finance, 1992) that once company size is taken into account, beta alone did not explain differences in average returns across US stocks. Beta remains useful for understanding sensitivity to the market, not for measuring all of the risk.
Our data: 2,547 US stocks
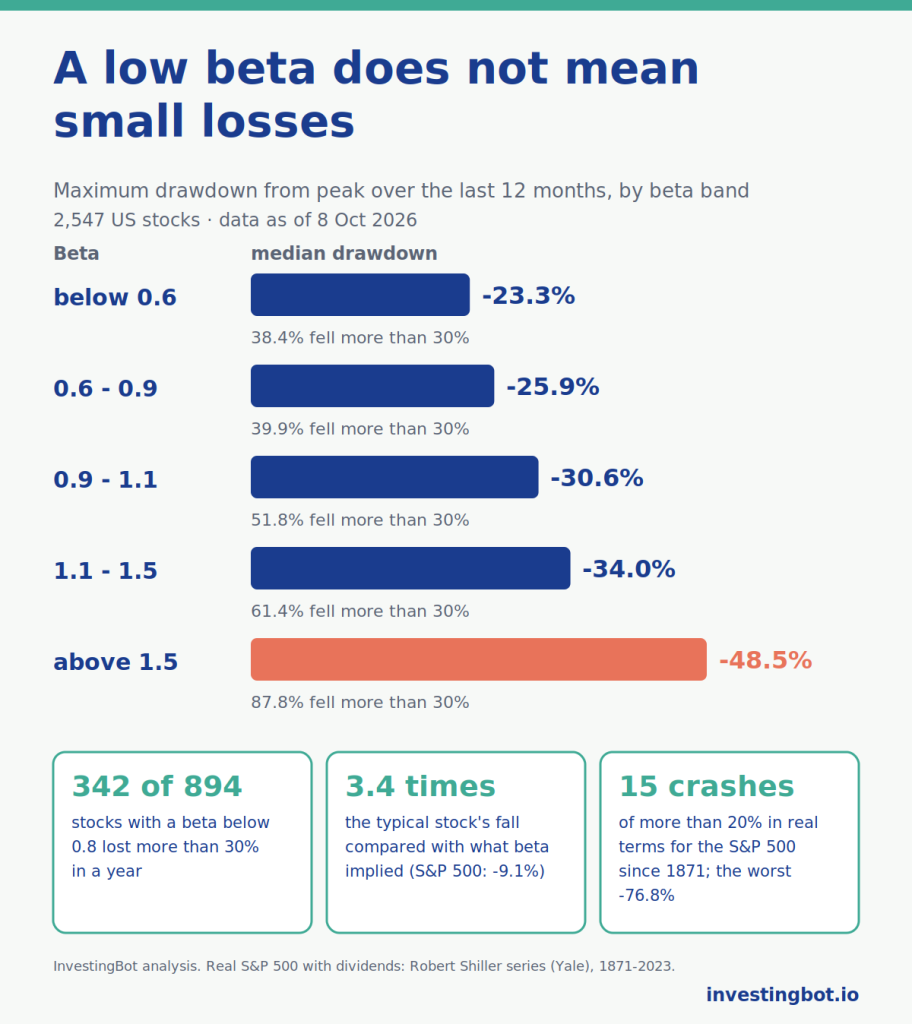
For 2,547 US stocks on the platform we put together the beta shown on the company page and the maximum drawdown from peak over the last twelve months, up to 8 October 2026. The result by beta band:
| Beta | Stocks | Median maximum drawdown | Stocks down more than 30% |
|---|---|---|---|
| below 0.6 | 523 | -23.3% | 38.4% |
| 0.6 – 0.9 | 576 | -25.9% | 39.9% |
| 0.9 – 1.1 | 388 | -30.6% | 51.8% |
| 1.1 – 1.5 | 578 | -34.0% | 61.4% |
| above 1.5 | 482 | -48.5% | 87.8% |
The trend is there: the higher the beta, the deeper the falls. But even in the lowest bands the typical loss exceeds 20%, and almost four stocks in ten lost more than 30%. Among stocks with a beta below 0.8, 342 out of 894 fell more than 30% and 109 more than 50%.
Beta says little about how far a single stock can fall
In the same year the S&P 500 had a maximum drawdown from peak of 9.1%. If beta were enough, a stock with a beta of 1 would have fallen about as much, one with a beta of 2 roughly twice as much. That’s not what happened: the typical stock fell 3.4 times what its beta would have suggested, and 85% of stocks lost more than twice that estimate.
Looking at how stocks rank, maximum drawdown lines up much more closely with volatility (rank correlation 0.83) than with beta (0.41). Volatility captures all of a stock’s swings, including those that have nothing to do with the market. This is consistent with what Andrew Ang and Robert Hodrick of Columbia University, together with Yuhang Xing and Xiaoyan Zhang, found in “The Cross-Section of Volatility and Expected Returns” (Journal of Finance, 2006): stocks with high volatility of their own, not explained by the market, had very low average returns.
An honest caveat: this is a single year, and a calm one for the index. In a year of broad market crash, beta matters more, because almost everything falls together.
How far a stock portfolio can really fall: over 150 years of data
In a well-diversified portfolio the specific risk of individual companies is diluted, and what remains is mostly market risk. History is clear about how deep that can go. On the S&P 500 series built by Robert Shiller (Yale), from 1871 to June 2023, with dividends reinvested and adjusted for inflation, we counted 15 crashes of more than 20%. The worst:
| From the peak | To the low | Real loss | Years to regain the peak |
|---|---|---|---|
| September 1929 | June 1932 | -76.8% | 7.2 |
| August 2000 | March 2009 | -51.8% | 12.8 |
| January 1973 | December 1974 | -50.1% | 12.0 |
| February 1937 | April 1942 | -48.3% | 8.2 |
| November 1916 | December 1920 | -47.1% | 7.8 |
Years are counted from the peak to the return to the same level, in real terms. The message is that even the most diversified index in the world has suffered falls close to half its value, and took more than a decade to recover them. For a long horizon, as in a regular investment plan, this is the figure to keep in mind before the average.
How to use beta and drawdown together
- Beta tells you how the stock reacts to market moves: useful to understand how it will behave when the index rises or falls.
- Volatility and drawdown tell you how far it can really fall, including for reasons of its own: useful to picture the worst case.
- A low beta is not protection: it protects you from the market, not from the company.
- Diversification reduces specific risk; market risk remains, and history shows how deep it can go.
- The practical test: imagine seeing your portfolio at half its value for a few years. If your gut reaction is to sell, the risk you’re taking is too high for you, whatever the beta. Tools such as the Monte Carlo simulation help you see those unfavourable cases before they happen.
Where to find these numbers on InvestingBot
On every company page you’ll find beta, volatility and the one-year maximum drawdown from peak, each with its explanation. Every ETF page also shows the fund’s beta and its maximum drawdown from peak, so you can compare different instruments on the same yardstick. They are data, not verdicts: they help you get a sense of how much what you’re looking at can move.
In short
- Beta measures how much a stock moves with the market, on average; drawdown how far it has fallen from its peak.
- Losses are not symmetrical: after -50% you need +100% to break even.
- In our data, the higher the beta, the deeper the falls, but even among stocks with a beta below 0.8 almost four in ten lost more than 30% in a year.
- In a year when the S&P 500 lost at most 9.1%, the typical stock fell 3.4 times what its beta suggested.
- Volatility explains the falls of individual stocks far better than beta.
- Since 1871 the S&P 500 has had 15 real crashes of more than 20%, the worst of 76.8%, and sometimes more than ten years to recover.
What is a stock’s beta?
It is a number that measures how much a stock tends to move with the market. With a beta of 1 it follows the index on average, above 1 it amplifies its moves, below 1 it dampens them. It is calculated by comparing the stock’s returns with the index’s returns over the same period.
Does a low beta mean the stock is safe?
No. Beta only measures the market-related part of risk. In our data, among US stocks with a beta below 0.8, 342 out of 894 lost more than 30% in twelve months for reasons beta doesn’t see.
What is maximum drawdown?
It is the deepest fall from a peak to the lowest point that follows over a given period. It answers the question “how much could I have lost at the worst moment?”.
How much do you need to recover from a drawdown?
More than you lost: after a 20% fall you need a 25% gain, after a 30% fall 42.9%, after a 50% fall 100%.
How far can a diversified stock index fall?
On the S&P 500 since 1871, in real terms and with dividends reinvested, there have been 15 crashes of more than 20%. The worst, between 1929 and 1932, reached 76.8%; after the 2000 peak it took 12.8 years to get back to the same level.
Should I look at beta or volatility?
They serve different purposes. Beta tells you how the stock reacts to the market; volatility tells you how much it swings overall. In our data, the maximum drawdown of individual stocks lines up far more closely with volatility than with beta.