



Correlation measures how much two investments move together: close to 1 they rise and fall at the same time, close to 0 each goes its own way. The catch is that it does not stand still. On our data, in the 10 worst sessions of the S&P 500 since 1998 all nine original sectors fell together, 90 cases out of 90: diversifying across sectors protects least exactly when you need it most.
What correlation is, in a nutshell
Correlation is a number between -1 and +1 computed on the returns of two stocks, sectors or asset classes over the same period:
- close to +1: when one rises the other rises too, when one falls so does the other;
- close to 0: the two moves are unrelated, and holding both reduces the swings;
- below 0: they tend to move in opposite directions, and one cushions the losses of the other.
The measurement period matters. A correlation computed over five years describes the average; one computed over the last 60 trading days describes the moment, and it changes far more.
Why it matters for diversification
The idea that a portfolio’s risk is not the sum of its holdings’ risks goes back to Harry Markowitz, “Portfolio Selection” (Journal of Finance, 1952): what matters is how the holdings move relative to each other. The lower the correlation, the more the swings offset each other and the less the portfolio moves than its parts.
Our data shows it. A portfolio split equally across the nine sectors moved on average 70% as much as the typical sector when the market was near its highs: a saving of about 30%. In bear markets the ratio rose to 87%: the saving shrank to 13%.
Our data: 28 years of US sectors
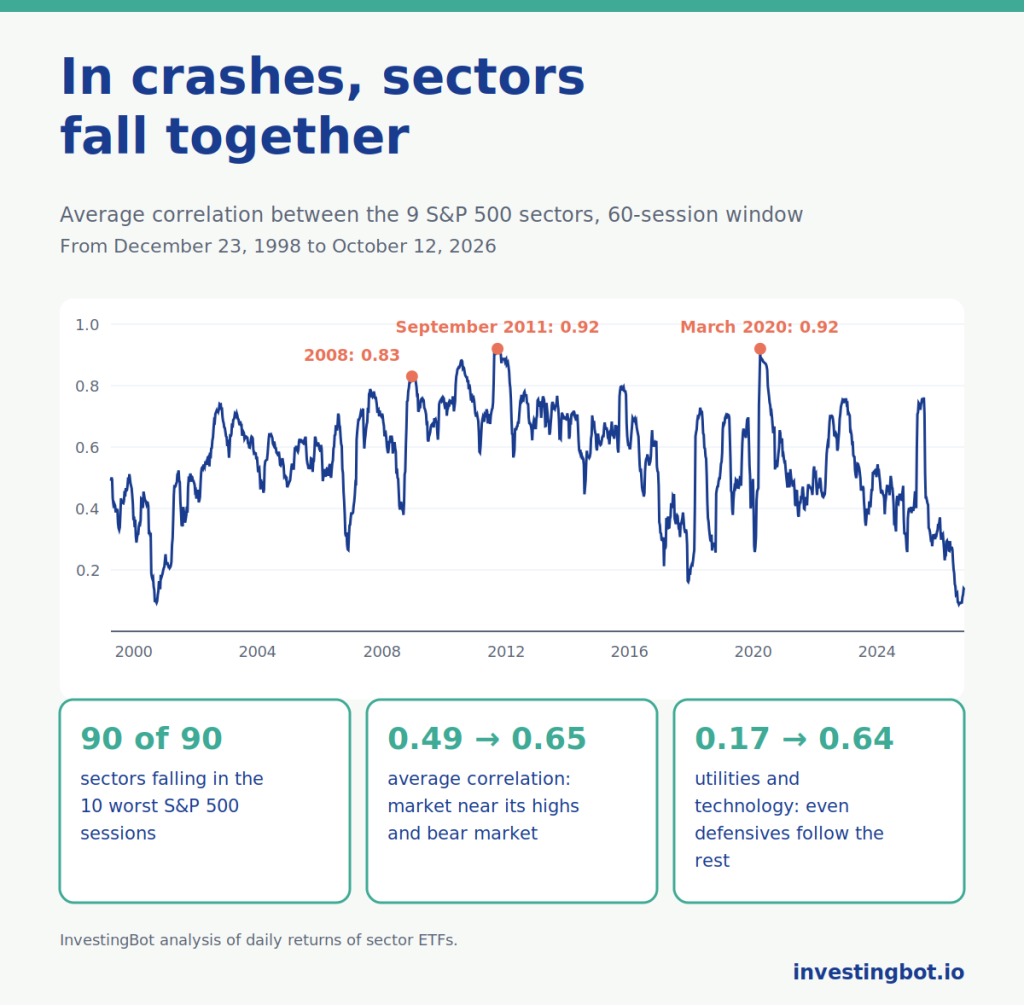
We used the daily returns of the nine funds that track the original S&P 500 sectors (energy, materials, industrials, consumer discretionary, consumer staples, health care, financials, technology, utilities), from December 23, 1998 to October 12, 2026: 6,992 sessions. For each day we computed the average correlation across all pairs of sectors over the previous 60 sessions.
| Market moment | Average correlation between sectors |
|---|---|
| Market within 5% of its highs | 0.49 |
| Whole period (median) | 0.58 |
| Bear market (more than 20% below the highs) | 0.65 |
| 2008 peak | 0.83 |
| Peak of September 22, 2011 | 0.92 |
| Peak of March 16, 2020 | 0.92 |
The same pattern repeats in every crisis: 0.74 in the 2000-2002 crash, 0.83 in 2008, 0.92 in 2011 during the European debt crisis, 0.92 in March 2020, 0.76 in 2022 and 0.77 in 2025. When the market falls hard, sectors stop behaving like different markets and become almost a single one.
In crashes, everything falls
An average correlation is an abstract number. The worst days are more concrete:
- in the 10 worst sessions of the S&P 500 in the period (six in 2008, three in March 2020, one in August 2011) all nine sectors closed lower, 90 cases out of 90;
- in the 96 sessions when the S&P 500 lost more than 3%, 98.4% of sector-day combinations were negative, and all nine sectors fell together in 87.5% of cases.
Even the sectors considered defensive follow the rest. The correlation between utilities and technology is 0.17 when the market is near its highs and rises to 0.64 in bear markets; between consumer staples and technology it goes from 0.21 to 0.64. Defensives usually lose less, but they lose.
Why it happens
In moments of panic, common drivers outweigh specific ones. Investors cut risk across the board and sell whatever they can sell; leveraged players have to reduce positions; funds have to meet redemptions. News about individual sectors matters less than the question everyone asks at the same time: how much risk do I want?
Research has documented this for a long time. François Longin (ESSEC) and Bruno Solnik (HEC Paris), in “Extreme Correlation of International Equity Markets” (Journal of Finance, 2001), showed that across major stock markets correlation increases in sharply falling markets, but not in sharply rising ones. Andrew Ang (Columbia) and Joseph Chen (University of Southern California), in “Asymmetric Correlations of Equity Portfolios” (Journal of Financial Economics, 2002), found the same imbalance between US stocks and the market.
There is a caveat. Kristin Forbes and Roberto Rigobon (MIT), in “No Contagion, Only Interdependence” (Journal of Finance, 2002), showed that part of the increase is a statistical effect: when volatility rises, measured correlation rises even if the underlying link does not change. For anyone holding a portfolio, though, the consequence is the same: the pieces lose together.
Stocks and bonds: diversification that can change
For many years real protection came from another asset class. Between the S&P 500 and 7-10 year US Treasuries, correlation was negative in 20 years out of 25 since 2002: -0.47 in 2008, -0.51 in 2020. When stocks crashed, bonds rose.
But it is not a law. In 2022, with high inflation and rapidly rising rates, correlation turned +0.19 and stocks and bonds fell together. On average it was -0.35 from 2003 to 2021 and +0.13 from 2022 to today. How much a portfolio can lose when its protections fail is what we measured in our article on beta and drawdown.
How to use correlation: the right questions
- Over what period is it measured? A five-year average hides crises; it is worth looking at how it behaved in periods of sharp decline too.
- Are my sectors really different? Since June 2018 the correlation between technology and consumer discretionary has been 0.81, between technology and communication services 0.78, against 0.39 between technology and energy. More sectors does not mean more sources of risk.
- What protects me in a crash? Among equity sectors, not much. Sturdier diversification comes from different asset classes, and that too needs checking over time.
- Is today’s correlation normal? On October 12, 2026 the average correlation between sectors was 0.14: since 1998, values below 0.2 have appeared in only 3% of sessions. Correlations this low do not last in periods of stress.
- Do I want to diversify or to rotate? When sectors each go their own way, return differences widen. We cover this in our guide to sector rotation.
Where to find these numbers on InvestingBot
On the Correlations page you will find the matrix of the eleven S&P 500 sectors over periods from one month to five years, with the most and least correlated pairs and a 0.75 threshold above which two sectors are flagged as of little use for diversification. You can pick two sectors and see their rolling correlation over windows from 20 to 90 sessions, to understand whether today’s link is the usual one. The matrix can be opened in the AI Chat with the data already loaded.
In short
- Correlation measures how much two investments move together, from -1 to +1.
- Across the nine original S&P 500 sectors it averaged 0.49 with the market near its highs and 0.65 in bear markets, with peaks of 0.92 in 2011 and in March 2020.
- In the 10 worst sessions since 1998 all nine sectors fell together, 90 cases out of 90.
- The benefit of diversifying across sectors shrank from about 30% to 13% in bear markets.
- Stocks and bonds had negative correlation in 20 years out of 25, but in 2022 they fell together.
- Diversification should be judged on how it behaves in crashes, not on the average.
What is correlation between stocks?
It is a number between -1 and +1 that measures how much the returns of two stocks or sectors move together. Close to +1 they move in the same direction, close to 0 independently, below 0 in opposite directions.
Why does correlation rise in crashes?
In moments of panic investors cut risk across the board and sell a bit of everything, and common drivers matter more than sector-specific ones. It is also partly a statistical effect of higher volatility. On our data the average correlation between sectors went from 0.49 to 0.65 in bear markets.
Do defensive sectors protect in a crash?
They usually lose less, but they lose. The correlation between utilities and technology rises from 0.17 to 0.64 in bear markets, and in the 10 worst sessions of the S&P 500 since 1998 every sector fell.
Do bonds always diversify stocks?
Not always. Since 2002 the correlation between US stocks and 7-10 year Treasuries was negative in 20 years out of 25, but in 2022, with inflation and rates rising, it was positive and the two asset classes fell together.
Over what period should correlation be measured?
It is worth looking at more than one: a multi-year average shows the underlying link, a 60-session rolling window shows how it changes over time, and behaviour in periods of sharp decline shows what diversification is really worth.
Is low correlation always a good sign?
It is a good sign for diversification, but it should not be taken for granted. On October 12, 2026 the average correlation between sectors was 0.14, a rare level, and in periods of stress low correlations tend to rise quickly.