



In our article on technical analysis we put the most popular chart signals to the test: over thirty years of data and millions of cases, the famous ones did almost nothing. The next question is obvious: what about the other school? Does fundamental analysis, the one that reads balance sheets instead of charts, actually work? We did the same thing. We went through the most cited academic studies of the past forty years, then redid the sums on our own data: about 2,900 US companies from 2017 to 2025.
The short answer is yes, fundamental analysis has a foundation, and a much more solid one than technical analysis. But it works differently from how beginners imagine it: it gives a small, slow edge full of exceptions on groups of companies, not a forecast for a single stock; and it says something about how much an investment may return, almost nothing about when. The rest of this article explains why, with the numbers.
What fundamental analysis is, in two lines
A share is a piece of a company. Fundamental analysis starts there: it looks at the company’s accounts, how much it sells, how much it earns, how much it owes the banks, how much cash it keeps, and compares all of this with the price the market asks for that piece. The idea is as old as the modern stock market: Benjamin Graham wrote it down in the thirties, and his best-known pupil, Warren Buffett, has applied it for seventy years.
The basic tools are few. The P/E, or price-to-earnings ratio, tells you how many years of profits you pay to buy the company: 10 is little, 40 is a lot. The P/B, or price-to-book ratio, compares the price with what the company owns net of its debts. Profitability tells you how much the company earns relative to what it employs. Earnings quality separates the profits that actually came in as cash from those that exist only on paper. Someone doing fundamental analysis is looking, in short, for good companies at a reasonable price.
The uncomfortable question is whether that search pays. If the market were perfectly efficient, everything you can read in the accounts would already be in the price, and reading them would give no edge at all. The studies say that is not the case, but they also say how small the edge is.
What the studies say: the accounts anticipate returns
The first robust result is that some accounting information distinguishes, on average and over long horizons, the shares that will return more from those that will return less. Eugene Fama and Kenneth French (Journal of Finance, 1992) showed on almost thirty years of US data that two simple numbers, the size of the company and the ratio of book value to price, explained the differences in returns between shares better than “beta”, the risk measure the theory had used until then. Josef Lakonishok, Andrei Shleifer and Robert Vishny (Journal of Finance, 1994) explained why: investors extrapolate the past too far, pay too much for fashionable companies and too little for boring ones, and the gap closes over time.
The second result is that reading the accounts, and not just looking at a multiple, adds information. Joseph Piotroski (Journal of Accounting Research, 2000) took the shares that were cheapest on book value and sorted them with nine elementary accounting checks: positive profit, positive cash flow, falling debt, improving margins and so on. Those passing almost all the checks beat the cheap group by about 7.5 points a year. Richard Sloan (The Accounting Review, 1996) found that the market does not tell cash profits from “accrued” ones: companies with lots of paper profits and little cash returned less, and the strategy exploiting this earned over 10% a year, with a positive outcome in 28 years out of 30.
The third result is that quality pays even when it costs. Robert Novy-Marx (Journal of Financial Economics, 2013) showed that gross profit relative to assets predicts returns as well as the P/B does, and that the most profitable companies return more despite being more expensive. Cliff Asness, Andrea Frazzini and Lasse Pedersen (Review of Accounting Studies, 2019) measured the same premium in 24 countries: “quality” companies, profitable, growing, safe and well run, return more and are less risky than “junk” ones.
The fourth result is the most surprising. Söhnke Bartram and Mark Grinblatt (Journal of Financial Economics, 2018) built a “fair value” with no financial expertise at all: a simple statistical regression on the most common accounting items, with no growth estimates, no discount rates, no judgement. Buying the shares below that value and selling those above it returned up to 9-10% a year after adjusting for risk, and the gap closed in about 34 months. If a method that crude works, the content of the accounts is not all in the price.
And Buffett? Frazzini, David Kabiller and Pedersen (Financial Analysts Journal, 2018) took his returns apart: once you account for the fact that he buys cheap, safe, high-quality companies and holds them with a stable financial leverage of about 1.7 times, his unexplained edge disappears. That is no belittling: it is proof that his method can be replicated in its principles, if not in its discipline. His public stock portfolio did better than the companies he owns outright.
The limits: edges get used up, and many do not hold
So far the good news. The bad news comes in three parts, each just as well documented.
Discovered edges shrink once they become known. David McLean and Jeffrey Pontiff (Journal of Finance, 2016) tracked 97 selection rules published in academic journals: after the end of the period studied they returned 26% less, and after publication 58% less. The paper-profits anomaly discovered by Sloan is the textbook case: Jeremiah Green, John Hand and Mark Soliman (Management Science, 2011) found it, fifteen years later, no longer reliably positive. The market learns.
Many “discoveries” do not survive a serious check. Kewei Hou, Chen Xue and Lu Zhang (Review of Financial Studies, 2020) redid the sums for 452 published anomalies with value weights and without micro-caps: 65% failed the simple statistical test and 82% failed the one corrected for the number of attempts. Campbell Harvey, Yan Liu and Heqing Zhu (Review of Financial Studies, 2016) counted 316 “factors” proposed in the literature and concluded that the bar of proof had to be raised, because with that many attempts something random always gets through. Part of published fundamental analysis, in other words, is noise that looked like a signal.
Accounting numbers age. Baruch Lev and Anup Srivastava (Critical Finance Review, 2022) show that the price-to-book ratio has lost power since the late eighties because companies expense their investments in research, software and brands instead of booking them as assets: the “book value” of a technology company says less and less about what it is worth. A multiple computed correctly on an outdated definition is a wrong multiple.
To these three limits add a practical one. Professional analysts’ target prices, which many use as a shortcut, are not very reliable: Mark Bradshaw, Lawrence Brown and Kelly Huang (Review of Accounting Studies, 2013) measured over ten years that only 38% of twelve-month targets are met at the deadline, 64% at some point during the year, with an average error of 45%. And professional fund managers, who do fundamental analysis for a living, fail to turn it into returns for their clients: Fama and French (Journal of Finance, 2010) estimate that, net of costs, only about 3% of funds do enough to cover their own fees.
Our measure: 2,900 US companies, nine years
The studies above almost all cover past decades and data we do not have. So we redid the sums on what the platform does have: the annual accounts of 2,914 companies listed today in the United States and their prices, for 21,250 pairs of accounts and following year from 2017 to 2025. The method is the one used in the studies: four months after the end of each fiscal year, when the accounts are public for everyone, we compute for each company the P/E, the P/B, gross profitability on assets and the share of profits not collected in cash; we split the companies into five equal groups for each measure, year by year; and we measure how much each group returned over the following twelve months, dividends included.
One warning before the numbers, because it changes how to read them: we only have the companies listed today. Those that went bankrupt or were delisted in these years are not there. This is the so-called survivorship bias, and you can see it immediately in the data: the companies that were loss-making returned more than the profitable ones, on average, in 7 years out of 9. Not because losing money is good for you, but because the loss-making companies we see today are the ones that recovered; the ones that did not recover have disappeared from the list. Looking at the “typical” company instead of the average, that is the median, loss-making companies return less in 6 years out of 9. Keep that in mind: the numbers that follow are, if anything, optimistic.
The P/E: paying little for profits helps, on average
Among profitable companies, the fifth with the lowest P/E returned on average 20.7% over the following twelve months, the fifth with the highest P/E 14.2%: about 6.3 points a year of difference, in favour of the cheap ones in 6 years out of 9. Removing the smallest fifth of companies, as Hou, Xue and Zhang recommend, the edge remains (5.9 points, 5 years out of 9). In the three wrong years, though, the cheap ones lost against the expensive ones by 8.6, 18 and 6.7 points: anyone following the rule from 2018 to 2019 would have had two years in a row to doubt it.
The P/B: the premium lives in the small caps
On price-to-book the average gap is larger, 12.4 points, but almost all of it vanishes once the smallest companies are removed: 2.6 points remain, and the cheap ones win only 4 years out of 9. This is exactly what Lev and Srivastava say: for large, modern companies book value has lost its meaning; for small ones, often industrial or financial, it still counts for something, but these are also the companies that are hardest and most expensive to actually invest in.
Profitability and earnings quality: the mean says yes, the median says no
The most profitable companies on gross margin returned on average 4 points more than the least profitable, better in 6 years out of 9. But the typical company in the best group returned less than the one in the worst group (median 5.1% against 5.9%), and in the last two years the “low profitability” group, full of companies in their development phase, won by a mile: 19 points in 2024 and 37 in 2025. The same goes for earnings quality: companies collecting more cash than they report returned on average 8 points more than those reporting more than they collect, better in all nine years; but the median says the opposite (4.2% against 7.6%), and without micro-caps the edge falls to 4.7 points with 6 years out of 9. In plain words: in these groups the average is made by a few lucky cases, not by the rule.
Cheap and profitable together
The most stable result comes from the combination, as in Piotroski and Novy-Marx: the companies in the cheaper half on P/E and in the more profitable half beat the expensive and unprofitable ones in 8 years out of 9, and did better than the average of all companies in 6 years out of 9. The only year they clearly lost is 2025, the year of the loss-making companies bouncing back.
The number that matters most
In every group, even the best, a huge share of companies lost money over the twelve months: between 39% and 45%, whatever measure was used to select them. The cheapest fifth on P/E had 38.8% losers, the most expensive 44.5%. The edge of fundamental analysis, in our data as in the studies, lies in those five or six points of difference between groups of hundreds of companies. On a single stock, the probability of being wrong stays close to a coin toss.
Why it works “on average” and not on a single stock
This is the point that separates those who use fundamental analysis well from those who end up disappointed. An accounting measure shifts the odds by little: the good group returns a few points more than the bad group, but within each group companies scatter enormously, because over the following twelve months things happen that no balance sheet contains, a product that fails, a lawsuit, a takeover, a change in interest rates. Richard Grinold (Journal of Portfolio Management, 1989) wrote it as a formula: the result of a stock picker depends on the quality of their forecasts multiplied by the square root of the number of independent bets. With forecasts of modest quality, which is the case for anyone using fundamentals, the result comes from breadth, that is from many small positions, not from concentrating on two or three “safe” ideas.
There is also a matter of time. Bartram and Grinblatt measure in almost three years the time the price takes to close the gap with the estimated value; Lakonishok and colleagues count in years the comeback of neglected companies. Anyone reading a balance sheet and expecting confirmation within a few months is using the right tool on the wrong horizon.
Market timing: fundamentals say “how much”, not “when”
If a company’s accounts say something about its future return, the valuation of the whole market should say something about the market’s future return. In part this is true, but in a way that cannot be used to get in and out.
William Sharpe (Financial Analysts Journal, 1975) calculated that anyone wanting to switch between shares and cash must be right about 74% of the time just to match someone who stays invested, before costs and taxes. John Campbell and Robert Shiller showed in 1998 that the ratio of price to ten-year average earnings, the famous CAPE, is linked to the returns of the following ten years: when it is high, future returns have on average been lower. But in their own 2001 update they concluded that those ratios forecast returns poorly, and Ivo Welch and Amit Goyal (Review of Financial Studies, 2008) did the definitive check: they took every known variable for predicting the market and tested whether an investor using them in real time, without knowing the future, would have done better than one using the simple historical average. None would have helped, and most would have hurt.
The most honest conclusion comes from Asness, Antti Ilmanen and Thomas Maloney (Journal of Investment Management, 2017): valuation-based timing has the right direction but disappointing results outside the sample where it was discovered, and justifies at most modest tilts, “sin a little”. An expensive market returns less on average over the following ten years; it says nothing about next year, and it can stay expensive for a decade. It is the same thing we found when we tried to predict how much individual stocks would fall in past crashes from their beta: the typical error was 10-17 points, too much to build a decision on.
How much to put on each idea
If selection shifts the odds by little and timing by almost nothing, the question that remains is how to spread the money. Here too the literature is clear, and it goes against instinct.
Victor DeMiguel, Lorenzo Garlappi and Raman Uppal (Review of Financial Studies, 2009) compared 14 portfolio-optimisation methods with the dumbest possible rule, splitting into equal parts: no method beat it consistently, and to do so with 25 stocks you would have needed about 3,000 months of data, that is 250 years. The reason is the same as in this whole article: expected returns are estimated badly, and a portfolio built on wrong estimates concentrates the money exactly where the estimate is most optimistic.
Those who prefer a betting rule use the Kelly criterion, which computes the stake from the estimated edge. Leonard MacLean, Edward Thorp and William Ziemba (Quantitative Finance, 2010) listed its strengths and weaknesses: it maximises the growth of capital over the long run, but it can lose most of your wealth along the way; betting half of what the formula says, in their simulations the probability of halving your capital falls from 8.4% to 1%. And the critical ingredient of the formula is the estimated edge, which, for everything said above, is almost always overestimated.
Finally there is behaviour. Brad Barber and Terrance Odean (Journal of Finance, 2000) followed 66,465 US households for six years: those that bought and sold the most returned 11.4% a year against the market’s 17.9%. They did not get the analysis wrong; they did it too often, and paid every time.
Investing or speculating: where fundamental analysis helps and where it does not
Putting the studies and our numbers together, fundamental analysis is good for three things and not good for three others.
It is good for avoiding big mistakes: a company with unsustainable debt, profits that never turn into cash or a price that discounts twenty years of perfect growth can be recognised from the accounts, and keeping it out requires no forecast. It is good for tilting a broad portfolio towards cheap and profitable companies, which on average and over years return a few points more. It is good for knowing what you own, which is the only way not to sell at the wrong moment when the price falls without the accounts having changed.
It is not good for predicting the price of a single stock at twelve months: four companies out of ten in the best group lose anyway. It is not good for choosing the moment to enter or exit the market. It is not good, used on its own, for speculating, that is for making money in weeks or months: on those horizons the content of the accounts is already in the price, and what moves the stock is news and flows, which the accounts do not contain.
That is also how we use it on InvestingBot. A company’s page shows the accounting facts checked against several sources, the multiples with their definition, profitability and earnings quality with their traffic lights, and an estimate of fair value that is a range, not a number, with how uncertain it is written next to it. Analysts’ target prices are reported as what they are, opinions with an average error of 45%. None of these tools says when to buy: they say whether the price you pay is high or low relative to what you are buying, which is the only thing fundamentals can say.
In short
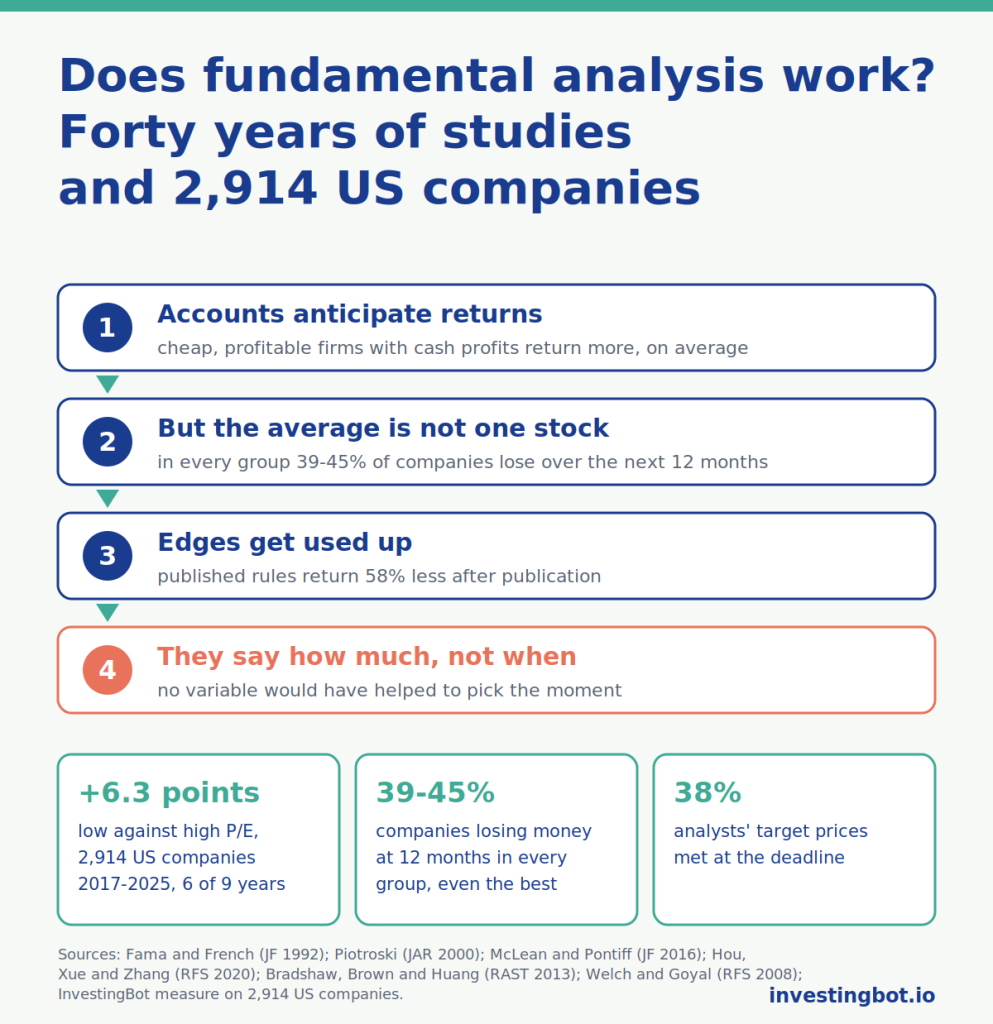
- Fundamental analysis has a solid empirical basis: companies that are cheap on earnings, profitable and whose profits turn into cash have returned more, on average and over horizons of years, in forty years of studies (Fama and French 1992, Lakonishok and colleagues 1994, Sloan 1996, Piotroski 2000, Novy-Marx 2013, Asness and colleagues 2019).
- The edge is small and gets used up: published rules return 58% less after publication (McLean and Pontiff 2016) and 65% of anomalies fail a serious check (Hou, Xue and Zhang 2020).
- In our data, 2,914 US companies from 2017 to 2025, the cheapest fifth on P/E returned 6.3 points a year more than the most expensive fifth, better in 6 years out of 9; cheap and profitable together beats expensive and unprofitable in 8 years out of 9.
- But in every group, even the best, between 39% and 45% of companies lost money over the twelve months: the edge is on groups, not on the single stock.
- Our numbers are optimistic: they contain only the survivors, and indeed loss-making companies “beat” profitable ones in 7 years out of 9 on average.
- Analysts’ target prices are met at the deadline in 38% of cases (Bradshaw, Brown and Huang 2013); active funds that cover their own costs are about 3% (Fama and French 2010).
- Market timing on valuations has the right direction at ten years and does not work in real time (Welch and Goyal 2008); to beat buy-and-hold you would need to be right 74% of the time (Sharpe 1975).
- On sizing, splitting into equal parts beats optimisation methods (DeMiguel and colleagues 2009), and those who trade more earn less (Barber and Odean 2000).
Does fundamental analysis really work?
Yes, in the sense that the studies and our data find an average edge of a few points a year for groups of companies that are cheap, profitable and whose profits turn into cash. No, in the sense that it does not predict a single stock: even in the best group about four companies out of ten lose over the following twelve months.
Does a low P/E mean the share is a bargain?
Not on its own. In our data the cheapest fifth on P/E returned on average 6.3 points more than the most expensive fifth, but lost the comparison in 3 years out of 9 and 39% of its companies lost money. The P/E has to be read together with profitability and earnings quality: cheap and profitable together beat expensive and unprofitable in 8 years out of 9.
Why do the edges of fundamental analysis shrink over time?
Because the market learns. McLean and Pontiff (2016) measured that published selection rules return 26% less outside the period studied and 58% less after publication. The paper-profits anomaly discovered by Sloan in 1996 was found, fifteen years later, to be no longer reliable.
Are analysts’ target prices reliable?
Not very. Bradshaw, Brown and Huang (2013) measured over ten years that only 38% of twelve-month targets are met at the deadline and 64% at some point during the year, with an average error of 45%. They should be read as opinions, not forecasts.
Can fundamental analysis be used to decide when to buy and sell?
No. Market valuations say something about average returns over the following ten years, but not about next year, and no known variable would have helped an investor in real time (Welch and Goyal 2008). To beat someone who stays invested, a market timer would have to be right about 74% of the time (Sharpe 1975).
How much should you invest in each share chosen with fundamentals?
A little in each and across many. Splitting into equal parts beats optimisation methods (DeMiguel, Garlappi and Uppal 2009), and a stock picker’s result grows with the number of independent bets more than with the quality of each one (Grinold 1989). Those using the Kelly criterion do well to bet half of what the formula says.
What is survivorship bias and why does it matter in this article?
It is the mistake of measuring only the companies still listed, forgetting those that went bankrupt or were delisted. Our data suffer from it: loss-making companies appear to have returned more than profitable ones in 7 years out of 9, because the loss-making ones that did not recover are no longer on the list. That is why all our numbers should be read as optimistic.