



The shelves of any financial bookshop are full of technical analysis manuals: moving averages, oscillators, chart patterns, cycles, retracements. They are written with care by people who have spent years in front of charts, and they really do teach you how to read them. What they almost never say is how often a signal has been followed by the move it promises. Academic research has been asking that question for more than thirty years, with decades of data and thousands of rules. This article summarises what it found, what holds up and what does not, and how we use those results on InvestingBot.
Independent evidence converges on a simple picture. Some families of signals have a measured basis: trend (what has gone up tends to keep going for a few months), volatility (which clusters and is predictable), volume as a sign that something is happening. Others have never passed a rigorous test: chart patterns as profit generators, Fibonacci retracements, Elliott waves, cycles. And one result applies to all of them: effectiveness depends on where and when you look, more than on the tool.
The first serious test: the Dow from 1897 to 1986
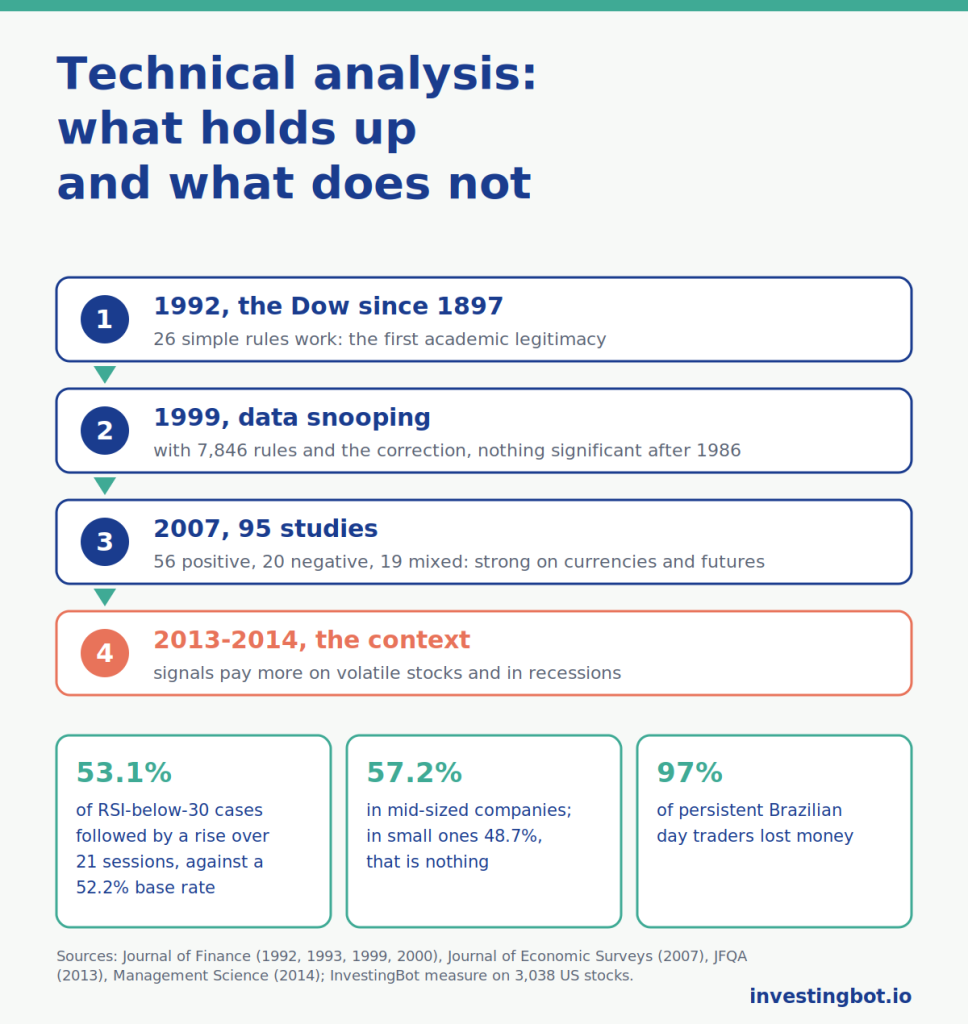
William Brock, Josef Lakonishok and Blake LeBaron, in “Simple Technical Trading Rules and the Stochastic Properties of Stock Returns” (Journal of Finance, 1992), applied 26 elementary rules, moving averages and trading range breaks, to the Dow Jones from 1897 to 1986. Returns after buy signals were higher and less volatile than those after sell signals, and the latter were negative on average. It was the study that gave technical analysis its first academic legitimacy.
The rebuttal: 7,846 rules and “data snooping”
Seven years later Ryan Sullivan, Allan Timmermann and Halbert White (“Data-Snooping, Technical Trading Rule Performance, and the Bootstrap”, Journal of Finance, 1999) redid the test, widening the universe to 7,846 rules from five families and correcting for the fact that, when you try thousands, some work by chance. The result: the best rules of the original sample lost all significance on data after 1986. The lesson still applies today, to anyone: the more indicators you try, the more “discoveries” you will find, and almost all of them are noise.
Cheol-Ho Park and Scott Irwin (“What Do We Know About the Profitability of Technical Analysis?”, Journal of Economic Surveys, 2007) reviewed 95 modern studies: 56 found positive results, 20 negative, 19 mixed. But the positive ones were concentrated in currencies and futures, and often ignored transaction costs and data snooping. On US stocks after the nineties the evidence is at its weakest.
What holds up: trend and momentum
The most robust result does not come from the manuals but from Narasimhan Jegadeesh and Sheridan Titman (Journal of Finance, 1993): buying the stocks that rose most over the previous six to twelve months and selling those that fell most earned in the order of one percentage point a month in their sample, and Tobias Moskowitz, Yao Hua Ooi and Lasse Pedersen (Journal of Financial Economics, 2012) found the same trend effect across dozens of markets and decades. Long moving averages are a crude version of the same idea: they work better as a risk filter, keeping you out of the big declines, than as a return generator. The 52-week high as a signal has a basis measured by Thomas George and Chuan-Yang Hwang (Journal of Finance, 2004).
Over short horizons the opposite holds. Narasimhan Jegadeesh, now at Emory University, found in 1990 (“Evidence of Predictable Behavior of Security Returns”, Journal of Finance) that a month’s return tends to reverse in the following month: between 1934 and 1987 the extreme deciles of his portfolios were 2.49 points a month apart. In the same year Bruce Lehmann, an economist who later taught at the University of California, San Diego (“Fads, Martingales, and Market Efficiency”, Quarterly Journal of Economics), saw the same reversal from one week to the next. This is the idea behind the RSI’s “oversold” signal: after a sharp fall, a small rebound is more likely. Momentum also has a known flaw: every so often it crashes. Kent Daniel of Columbia Business School and Tobias Moskowitz of the Yale School of Management (“Momentum Crashes”, Journal of Financial Economics, 2016) showed that the crashes come when the market recovers after a panic: between March and May 2009 the decile of the weakest stocks rose 163%, that of the strongest 8%.
Where it works best: volatility, small companies, recessions
This is the point that interests us most. Yufeng Han, Ke Yang and Guofu Zhou (Journal of Financial and Quantitative Analysis, 2013) applied a moving average to portfolios sorted by volatility: on the most volatile stocks the advantage over buy-and-hold was larger than that of momentum, on quiet stocks almost nil. Christopher Neely, David Rapach, Jun Tu and Guofu Zhou (Management Science, 2014) compared 12 technical indicators with 14 macroeconomic variables in forecasting the equity premium: the technical ones read business-cycle peaks better, the macro ones the recoveries, and together they beat both. In plain words: the same signal means different things in a volatile small cap during a recession and in a calm large cap in a quiet market.
What does not hold up
Andrew Lo, Harry Mamaysky and Jiang Wang (Journal of Finance, 2000) searched for the classic patterns, head and shoulders and the like, on US stocks from 1962 to 1996 with a recognition algorithm: weak informational content, not a trading advantage after costs. Fibonacci retracements, Elliott waves and Gann cycles have never shown predictive value in an independent study: they are systems that explain everything after the fact, which is why they cannot be refuted. And the multitude of oscillators, RSI, stochastic, MACD, CCI, Williams, is largely the same information under different names: they are all transformations of the same price series and move together.
Why the books sell anyway
Not out of bad faith. A manual that teaches how to read charts does an honest job, and the best authors say it clearly: technical analysis is a language, not a money machine. The problem is the buyer who hopes for the latter. Brad Barber and Terrance Odean (“Trading Is Hazardous to Your Wealth”, Journal of Finance, 2000) followed 66,465 households at a broker from 1991 to 1996: those that traded most earned 11.4% a year against 17.9% for the market. Fernando Chague, Rodrigo De-Losso and Bruno Giovannetti (“Day Trading for a Living?”, 2020) followed all Brazilian day traders in index futures: among those who persisted for more than 300 days, 97% lost money. The industry of courses and signals lives on the flow of new readers, and the visible “masters” are the survivors of a selection in which the losers stop publishing.
Our measure: one year, 3,038 stocks
We ran the simplest count on our US universe: 3,038 stocks, 257 sessions up to October 2026, and for each day the question “is the stock higher 21 sessions later?”. On any given day the answer is yes in 52.2% of cases. After an RSI below 30, the classic “oversold” signal, in 53.1%: one point above chance. After an RSI above 70 in 49.7%. With the price above the 50-day average in 50.3%, below it in 53.6%: this year mean reversion beat trend. And the difference by size is exactly the one in the studies: in mid-sized companies the oversold signal was followed by a rise in 57.2% of cases against a base of 53.6%, in small ones in 48.7% against 48.9%, that is nothing. Nor is the signal spread at random: in October 2025 the RSI below 30 fired 6,630 times, in April 2026 778. It comes in clusters, in moments of stress, when everything else matters too.
A single year proves nothing, which is why we repeated the same count over the whole history since 1994: 3,218 American companies, 14.7 million cases, always at 21 sessions. The picture holds, but the margins stay small. On any given day the stock is higher in 53.5% of cases; after an RSI below 30 in 55.1%, after an RSI above 70 in 51.7%. The edge of the oversold signal changes a lot from one period to another: 3.6 points between 1994 and 2002, less than one between 2003 and 2009 and since 2020. Momentum works mainly by exclusion: the fifth of stocks that were strongest over the previous twelve months rose in 53.3% of cases, as on any given day; the weakest fifth in 50.3%. A warning: the count only includes companies listed today, and those that collapsed until they disappeared are missing, so the edge of the oversold signal is probably overstated.
The 21-session measurement is too short for momentum, which in the studies works over several months. So we redid it the way Jegadeesh and Titman did: at the end of every month since 1995, we line up the stocks by their return over the previous twelve months (skipping the last one) and follow the strongest decile and the weakest decile over the following months. That is 380 months, on average 1,389 stocks a month, leaving out the least traded fifth. In the following month the strongest decile returned 1.82% on average, the weakest 1.53%, the average of all stocks 1.31%: an edge of 0.29 points a month for the strong over the weak, too little to rule out chance. Lengthening the horizon does not help: the best case is six-month momentum held for three to six months, at about 0.4 points a month, still below the statistical threshold. The reason shows year by year: the strong beat the weak in 25 years out of 32, with a typical year of +8 points, but a few crashes wiped it all out. In April 2009 alone the weak beat the strong by 54 points, and the whole of 2009 cost 107 points, 2000 cost 43 and 2016 cost 32. Short-term reversal shows up too: the month’s worst stocks returned 1.81% the following month, the best 1.34%. As a check we redid everything with the stocks sorted at random: the difference is zero, so the method does not invent effects.
How to read these numbers
Three things change how to read them. First: the benchmark is not 50% but 53.5%, because over the long run stocks rise and a stock picked at random is higher a month later slightly more than one time in two. A signal is worth something only if it beats that figure. Second: 14.7 million cases are not 14.7 million independent tests. Two consecutive days of the same stock share almost all of the following month, and in crashes the oversold signal fires on hundreds of stocks on the same day: the truly distinct observations are far fewer, which is why in the monthly measurement we computed significance taking this overlap into account. Third: the count only includes companies listed today. Those that went bust are missing, so the weakest decile looks better than it really was. This inflates the edge of the oversold signal and deflates that of momentum: studies on complete databases, which include the companies that disappeared, find stronger momentum than ours. None of the counts include commissions, spreads and taxes, which anyone who trades often pays at every step.
What changes for investors
- Always ask “how often”: a signal without a base rate is an opinion. If a book or a course does not give it, it is not evidence.
- Few families, each with a reason behind it: trend, short-term mean reversion, volatility, volume. Six indicators with different names are not six pieces of information.
- Context weighs more than the tool: the same RSI in a small cap during a crash and in a large cap in a calm market are two different things.
- Costs decide: many measured advantages vanish after commissions and spreads, and trading more has a documented price.
On InvestingBot the technical and quantitative analysis shows the indicators together with their context and does not present them as forecasts: this measurement over the history since 1994 is what we use to say how much a signal really weighs. Why predicting the bottom is nearly impossible is explained in the article on market timing; the mental traps that make you see patterns where there are none, in the one on the biases that cost you money.
In summary
- In 1992 Brock, Lakonishok and LeBaron found that 26 simple rules worked on the Dow from 1897 to 1986; in 1999 Sullivan, Timmermann and White, with 7,846 rules and the correction for data snooping, found nothing significant after 1986.
- Of 95 modern studies, 56 positive, 20 negative and 19 mixed: the evidence is stronger in currencies and futures, weaker in recent US stocks.
- Trend and momentum hold up (Jegadeesh and Titman 1993), as do volatility and volume; patterns, Fibonacci, Elliott and cycles do not.
- Effectiveness depends on context: stronger in volatile stocks and in recessions (Han, Yang and Zhou 2013; Neely, Rapach, Tu and Zhou 2014).
- Those who trade more earn less: 11.4% against 17.9% across 66,465 households; 97% of persistent day traders lost.
- On our universe over the past year an RSI below 30 preceded a rise in 53.1% of cases against a 52.2% base: one point, which becomes almost four in mid-sized companies and zero in small ones.
- On our history since 1995 the strongest stocks of the previous twelve months beat the weakest by 0.29 points a month: they win almost every year (25 out of 32), but lose heavily in rebounds after a panic, as in 2009.
Does technical analysis work?
Some families of signals have a measured basis, above all trend and momentum, and they work better on volatile stocks and in moments of stress. Most of the other tools have not passed independent tests, and almost all advantages shrink after costs.
What is data snooping?
It is the error of trying thousands of rules on the same data set and keeping the best one: some work by chance. Sullivan, Timmermann and White showed in 1999 that, correcting for this effect, the best rules on the Dow did not hold up on later data.
Are moving averages useful at all?
As a risk filter, yes: holding stocks above a long average avoided a good part of the big declines in studies spanning decades. As a return generator the advantage is small and concentrated in the most volatile stocks.
Does momentum really work?
In academic studies it is the technical signal with the strongest evidence: the stocks that rose most over the last six to twelve months tend to do better than those that fell most. On our history since 1995 the edge exists but is small, about 0.3-0.4 points a month, and it is not steady: it wins almost every year and loses heavily when the market rebounds after a crash, as in 2009.
Do chart patterns and Fibonacci have predictive value?
The 2000 study by Lo, Mamaysky and Wang found weak informational content in the classic patterns, not a trading advantage. For Fibonacci retracements, Elliott waves and cycles there is no independent study showing predictive value.
Why do studies say that traders lose?
Because trading often is costly: commissions, spreads and choices driven by overconfidence. Barber and Odean measured 11.4% a year against 17.9% for the market among the most active households; among persistent Brazilian day traders 97% lost.
How does InvestingBot use these results?
By showing the indicators together with their context, without presenting them as forecasts, and by measuring over the history since 1994 how often each signal was followed by the expected move: the margins are small, and we say so.