



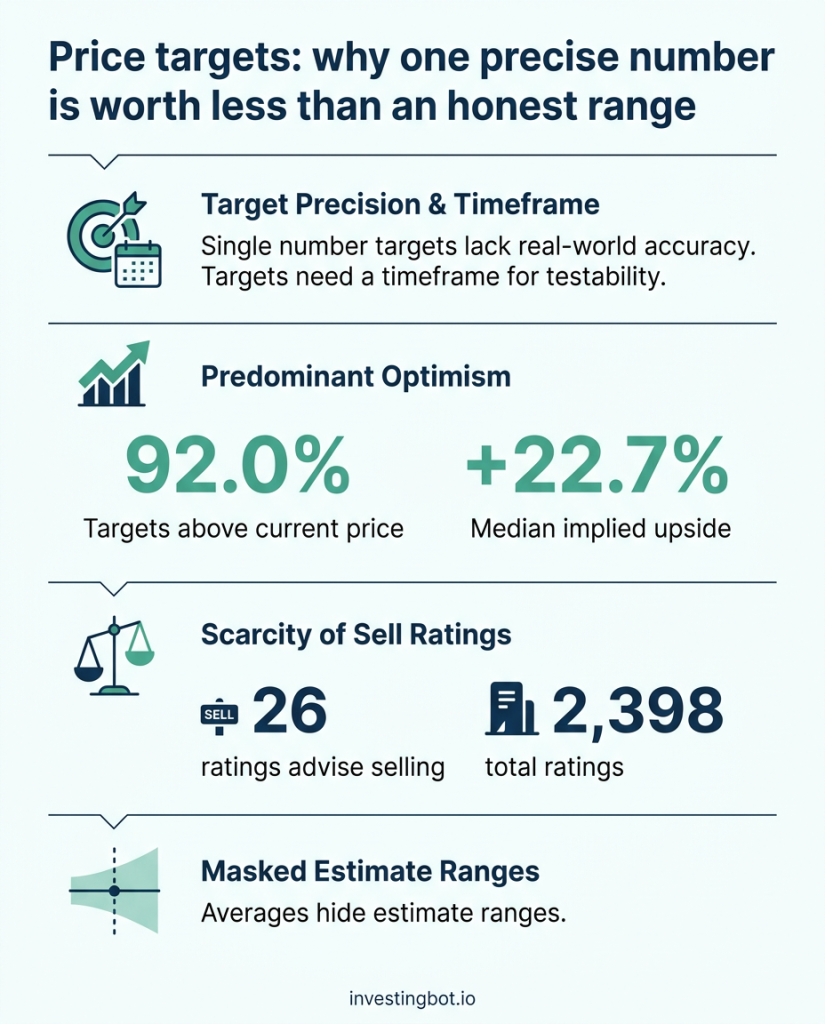
A price target is the price an analyst expects a stock to reach within a given period, usually twelve months. It arrives as a single number, often down to the cent. The trouble is not that it is wrong: it is that the shape of the number promises a precision nobody has. Across 2,315 US stocks with a target in our universe, 92.0% sit above the current price, and out of 2,398 ratings only 26 tell you to sell. A stated range, with a horizon and a declared degree of uncertainty, says less and gets it wrong less often.
What a price target actually is
A target is produced inside a brokerage. An analyst builds a model of the company’s accounts, assumes growth, margins and an exit multiple, and derives a price. The individual estimates are then averaged: what reaches your screen is the consensus, an average of opinions.
Two things vanish inside that average, and both matter more than the number left behind. The first is dispersion: an average of 100 can come from estimates all between 95 and 105, or from estimates between 40 and 160, and those are opposite situations. The second is the horizon: saying “it is worth 100” without saying by when is not a testable forecast.
The number that should stop anyone
We counted the targets across the US stocks in our working set. This is the picture:
| Across 2,516 US stocks | |
|---|---|
| have an analyst target | 2,315 (92.0%) |
| target above the current price | 2,129, or 92.0% |
| target below the current price | 184, or 7.9% |
| median implied upside | +22.7% |
| stocks with implied upside above +50% | 428 (18.5%) |
| ratings that say sell | 26 out of 2,398, or 1.1% |
If targets were neutral forecasts you would expect roughly half above the price and half below: the market cannot rise 22.7% on almost everything at once. Finding 92% above does not mean analysts are incompetent — it means that number is not a neutral forecast, and using it as one is a mistake.
Why the optimism is structural, not anyone’s failing
Academic research has studied this for decades, and the causes it identifies are structural rather than personal.
Whoever covers a stock chose to cover it
An analyst follows a limited number of companies and tends to follow the ones they think well of: someone who considers a business hopeless stops covering it, and their opinion leaves the consensus. The sample selects itself upward.
A negative rating has a cost
Roni Michaely (professor of finance at Cornell University) and Kent Womack (professor of finance at Dartmouth’s Tuck School of Business), in their 1999 study of the conflict of interest in underwriter analyst recommendations (Review of Financial Studies), documented the conflict between research and the rest of a broker’s business; Womack had already shown separately how rare sell recommendations are. The 1.1% we count today is the same thing, measured now.
A target is a destination, not the centre of a distribution
Alon Brav (professor of finance at Duke University’s Fuqua School of Business) and Reuven Lehavy (professor at the University of Michigan’s Ross School of Business), in their 2003 empirical study of analysts’ target prices (Journal of Finance), show that a target behaves like a level the stock could reach in the favourable case, rather than the most likely value. It is useful information, but it has to be read for what it is.
A number without a horizon cannot be tested
There is a second problem, independent of the optimism: how far a stock can move in a given time. This is not a matter of opinion, because the options market prices it explicitly, and that price can be read.
Across the large US companies we track most frequently, implied volatility corresponds to an expected swing of roughly 9.8% either way over thirty days: half the cases fall between ±8.0% and ±13.5%, and the most volatile name reaches ±45.3%. These are enormous, liquid businesses, not speculative bets.
A target quoted to the cent, over a twelve-month horizon, therefore sits alongside an uncertainty the market itself puts at tens of percentage points. The problem is not that the target is too optimistic: it is too narrow.
We measured our own range, not just everyone else’s
Criticising someone else’s precision is easy; the honest test is measuring your own. Our projection cone draws a band around the price within which the stock should stay: at one standard deviation, theory says it should contain the price about 68.3% of the time. We went and looked at where the price actually ended up, across every thirty-day window that has already expired and is therefore checkable.
| Cone test, 891 30-day windows | |
|---|---|
| the price stayed inside the band | 703 times, or 78.9% |
| expected from theory | about 68.3% |
| broke out above | 110 (12.3%) |
| broke out below | 78 (8.8%) |
The result says our cone is a little too wide: it promises less precision than it actually delivers. That is an error in the right direction, but it is still an error and we state it. The cause is known and we measured it separately: implied volatility exceeds the volatility that is actually realised in 66.5% of cases, with a median gap of 3.3 points. It is the premium demanded by whoever sells protection, and a long-studied feature of the research on variance risk premia.
When the methods disagree with each other
There is a third reason to distrust the single number, and it appears the moment you apply several methods to the same company on the same day. On one of the most heavily analysed businesses in the world, with public and predictable accounts, our models simultaneously return:
| Method | Value per share |
|---|---|
| Discounted cash flow | 298 |
| Growth relative to price (PEG) | 220 |
| Average analyst target | 327 |
The gap between the lowest and the highest estimate is 36%, and this is one of the easy cases: on that company our declared uncertainty is “low”. It is not that two of the three models are wrong. It is that they answer different questions — how much cash it will generate, how expensive it is relative to its growth, what the people who follow it expect — and there is no reason for them to agree on a number. What a company’s fair value is, and why no single figure exists, we covered separately.
Widening the count to hundreds of companies, the disagreement between methods lines up exactly with the uncertainty we declare:
| Declared uncertainty | Companies | Median gap between lowest and highest method |
|---|---|---|
| Low | 44 | 31.3% |
| Medium | 97 | 83.0% |
| High | 222 | 252.4% |
This is why we publish a band and a label instead of a number: when we write “high uncertainty” it is not a polite formula, it is methods answering with values a median of two and a half times apart. Collapsing that distance into one figure would throw away the only information that matters.
And within that fan the analyst target holds a recognisable position: across 363 companies it is the highest of all in 165 cases, and the lowest in only 52. It is not one method among others: it is systematically the one that promises most.
What to look at instead of the target
A range, not a point
A band of value states what is actually known. Narrow means the methods agree, wide means the case is genuinely uncertain — and that width is information, not noise to be removed.
The horizon, always written down
“It is worth 100” cannot be tested. “Within twelve months, with this much uncertainty, it plausibly sits between 80 and 120” can. A number that cannot be proved wrong is not a forecast.
The assumptions, not the conclusion
Every valuation rests on two or three assumptions that move it almost entirely: growth, discount rate, terminal multiple. Reading those is worth more than reading the result, because it lets you say “I do not believe that growth rate” instead of accepting or rejecting a number blind.
The distance between price and value, as a margin
Buying near the bottom of a wide band is different from buying in the middle of a narrow one. That is the margin of safety: it does not remove the error, it leaves room for one.
The limits of what we measured
These need stating, because they change how much weight these numbers carry.
The cone test rests on 891 windows on large US companies, over a limited period and in a single market phase: it says our cone runs a little wide in those conditions, not that it always will. The target count covers our set of US stocks, not every listed company in the world. The share of targets above the price also depends on the moment: in a sharp decline the imbalance would be wider still, because targets update more slowly than prices. And the fact that only 1.1% of ratings currently say sell is a measurement of now, not a law of nature.
Finally, the most important point: none of this says targets should be ignored. They tell you what the people who follow a company closely expect of it, and that is real information. They should be read as an interested opinion, optimistic by construction — not as a measurement.
In short
- 92.0% of the targets on the US stocks we track sit above the price, with a median implied upside of +22.7%: that is not a neutral forecast.
- Out of 2,398 ratings, 26 say sell. The optimism is structural and documented by decades of research.
- Over thirty days the market itself prices a swing of roughly ±9.8% on large companies: a target quoted to the cent over twelve months is more precise than anyone can be.
- Our cone contained the price 78.9% of the time against a theoretical 68.3%: it is a little too wide, and we say so.
- Where we declare “high uncertainty” the valuation methods sit 252.4% apart; where we declare “low”, 31.3%. The label corresponds to a measurable fact.
- On European stocks we show no target, because there is not a single declared analyst behind those numbers.
- A range with a horizon and an uncertainty says less than a precise number, and is more useful precisely for that reason.
Is a price target useful at all, or should it be ignored?
It is useful, but not as a forecast. It tells you what the people who follow a company closely expect of it, which is real information. Read it knowing it is optimistic by construction: almost always above the price, almost never paired with an invitation to sell.
Why are almost all targets above the price?
For three structural reasons: analysts choose to follow companies they think well of, a negative rating carries a cost for the broker, and the target is framed as a level reachable in the favourable case rather than as the most likely value.
Are a price target and fair value the same thing?
No. Fair value estimates what the business is worth based on its accounts; a target is the price an analyst expects on the market within a period. They can coincide, but they answer different questions: the first looks at the company, the second looks at the market.
Does a wide range mean the estimate was done badly?
The opposite, usually: it means the case is genuinely uncertain and whoever ran the numbers is saying so. A narrow range on an unpredictable business would be a worse estimate, not a better one — it would simply be less noticeable.
How do you actually use a range of value?
By looking at where the price sits within the band and how wide the band is. Near the bottom of a wide range there is more room for error than in the middle of a narrow one. And the range says nothing about timing: it needs a horizon attached, or it cannot be tested.
If a stock shows an enormous implied upside, is it an opportunity?
More often it is a sign the target has not been updated after a fall, or that a single stale estimate sits behind it. In our count almost one stock in five shows implied upside above 50%: numbers of that size need checking against how many analysts support them and how long they have gone unchanged.